Food & Drink Consumption
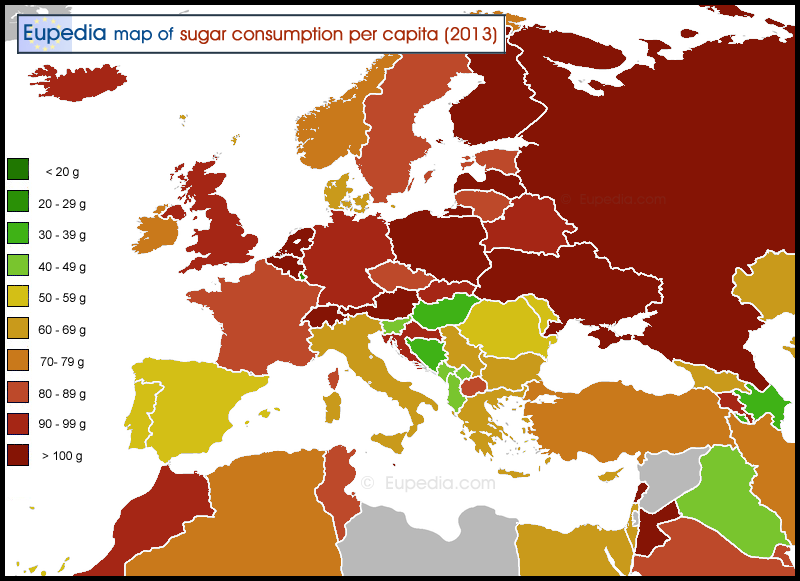
Sugar consumption per capita in grams per day (2013)
This map is based on the data was calculated from the annual consumption from the Helgi Library for 2013.
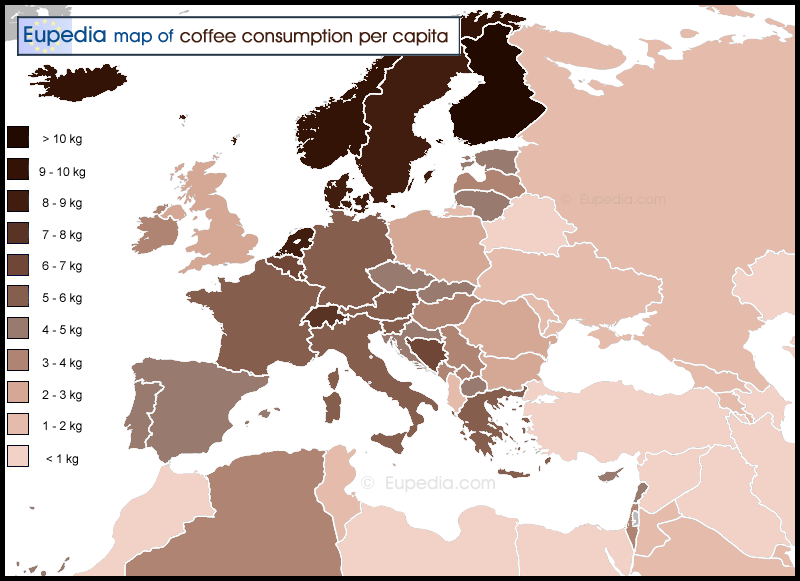
Coffee consumption per capita in kg per year
This map is based on the data from the World Resources Institute for 2008.
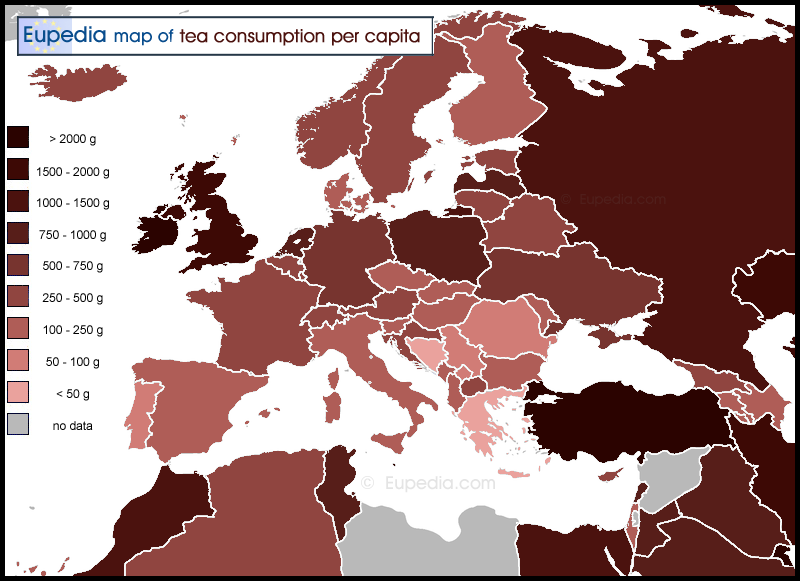
Tea consumption per capita in grams per year
This map is based on the data from the Helgi Library for 2013.
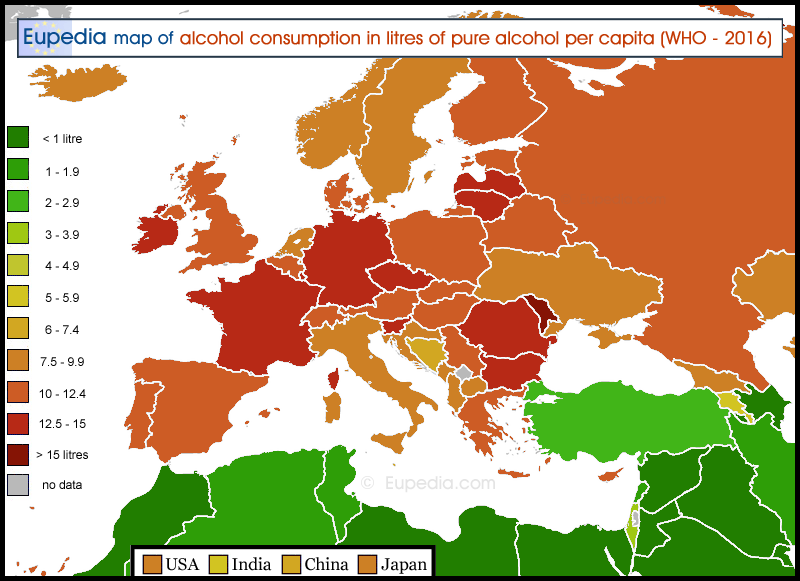
Alcohol consumption in litres of pure alcohol per capita per year
This map is based on the data from the World Health Organisation for 2016.
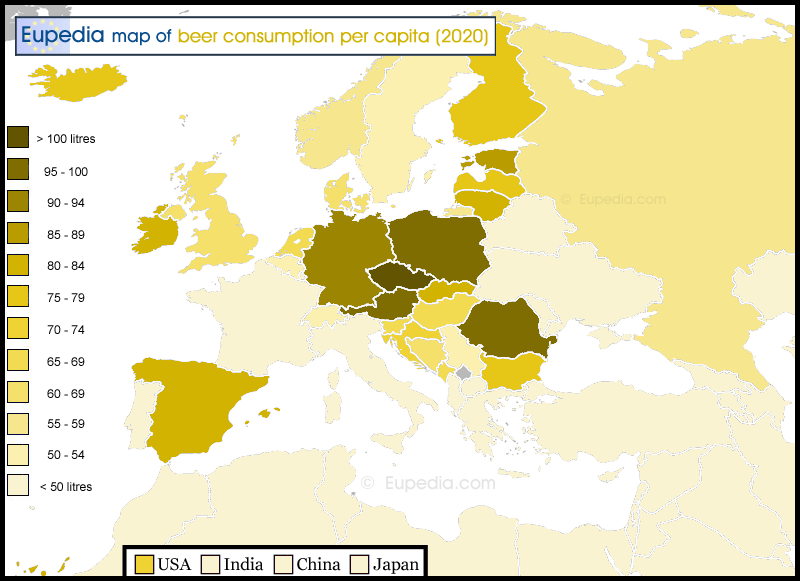
Beer consumption per capita in litres per year
This map is mostly based on the data from Kirin Holdings for 2020. Data from missing countries is from Helgi Library.
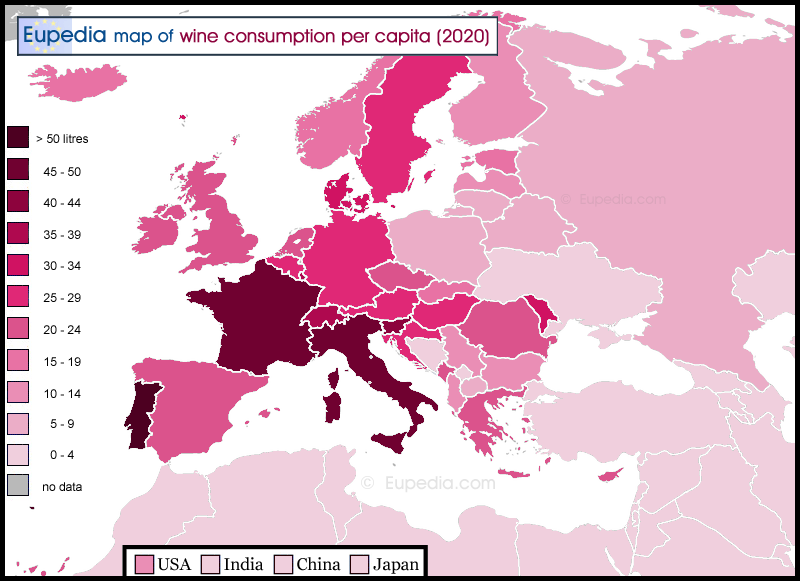
Wine consumption per capita in litres per year
This map is mostly based on the data from International Organisation of Vine and Wine (OIV) for 2020. Data from missing countries is from NationMaster.
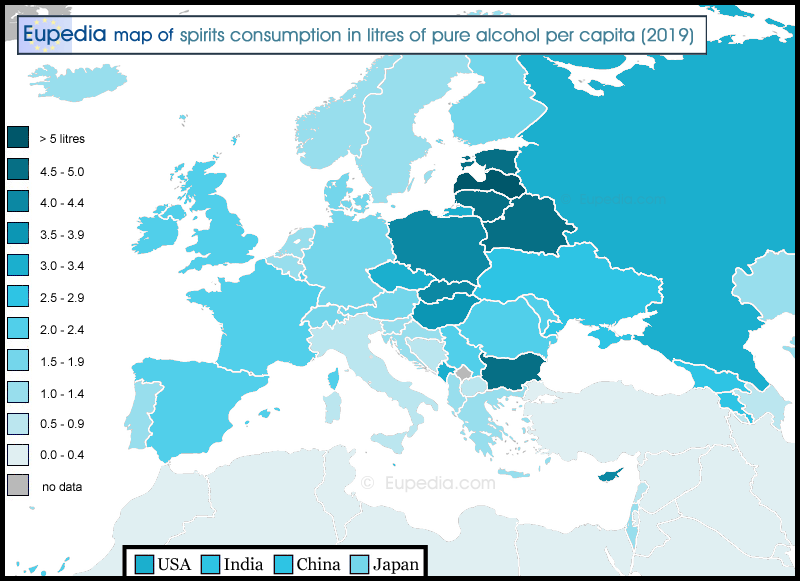
Spirits consumption per capita in litres of pure alcohol per year
This map is based on the data from Our World in Data for 2019.
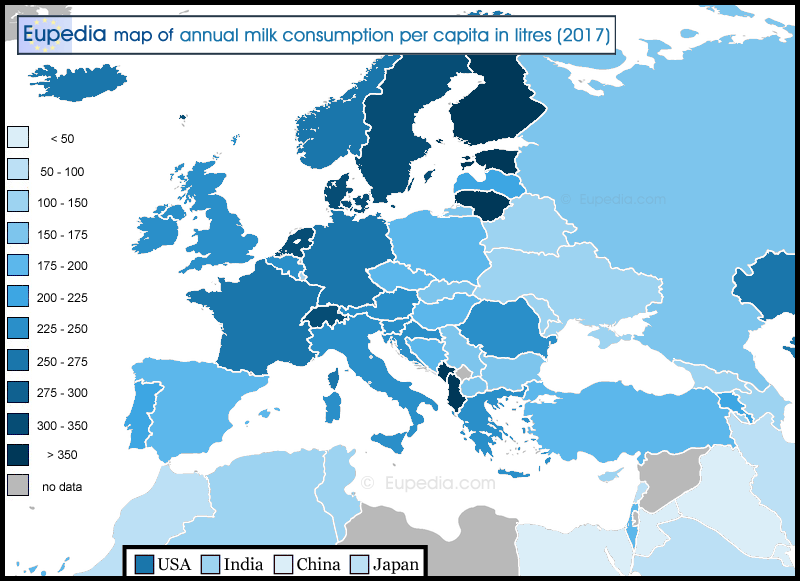
Milk consumption per capita in litres per year (2017)
This map is based on the data from the Our World in Data for 2017.
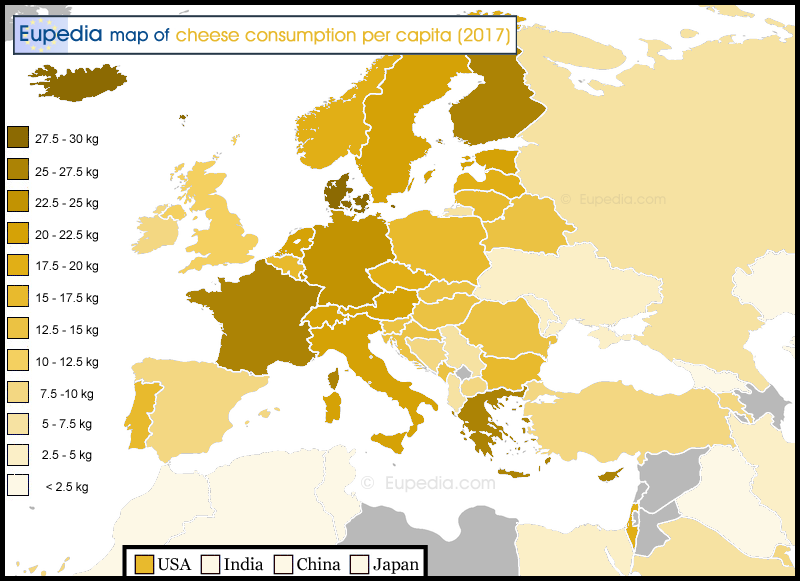
Cheese consumption per capita in litres per year (2017)
This map is based on the data from the StatInvestor for 2017. Data from missing countries was found on Statista or Helgi Libraby.
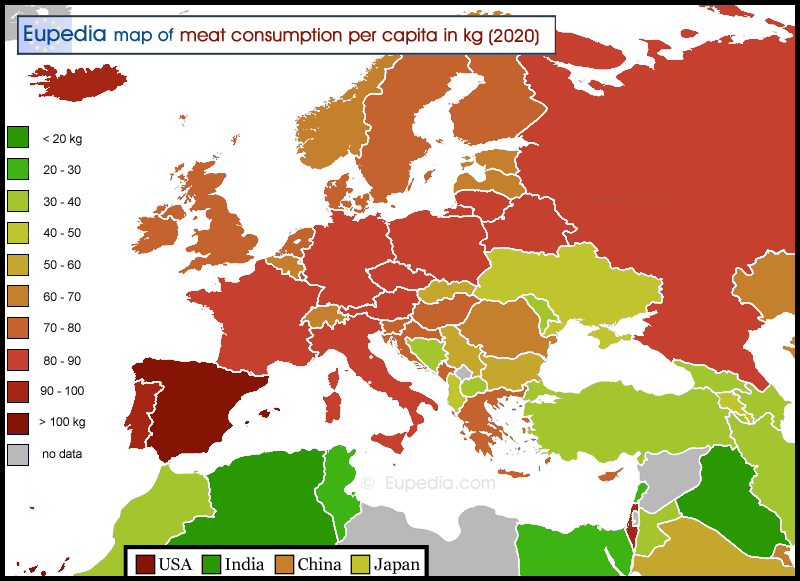
Meat consumption per capita in kg per year (2020)
This map is based on the data from the Our World in Data for 2020.
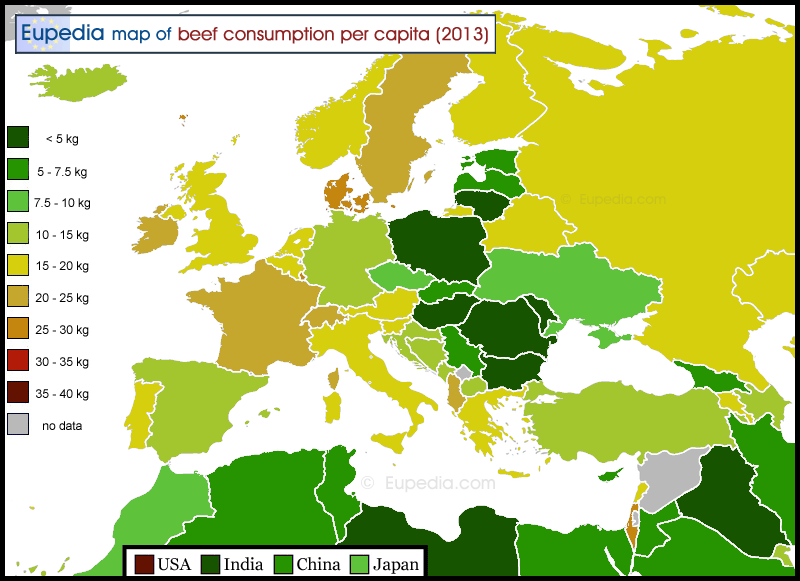
Beef consumption per capita in kg per year (2013)
This map is based on the data from Our World in Data for 2013.
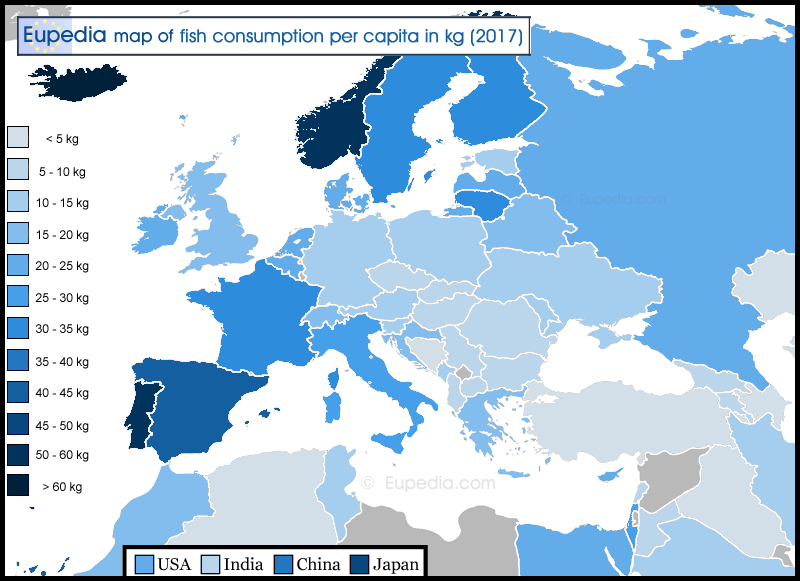
Fish consumption per capita in kg per year (2017)
This map is based on the data from the Our World in Data for 2017.
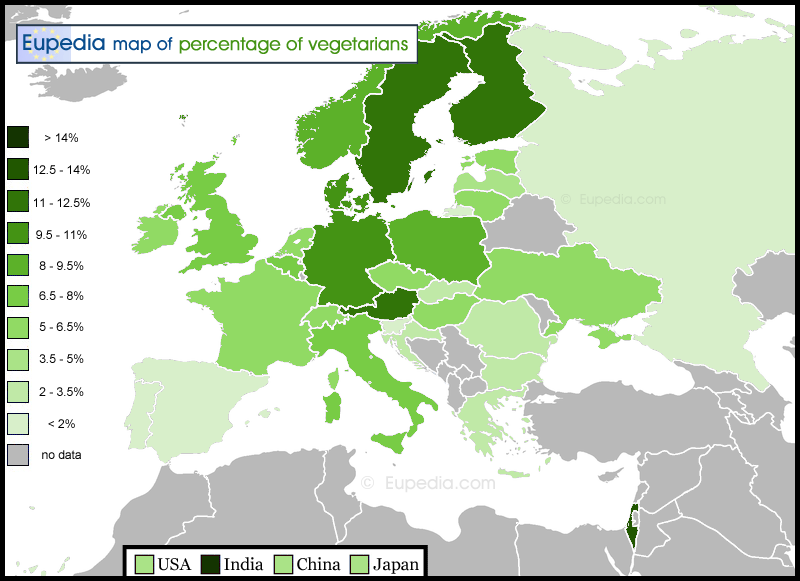
Percentage of vegetarians
This map is based on the data from Wikipedia and other sources for years ranging from 2017 to 2022.
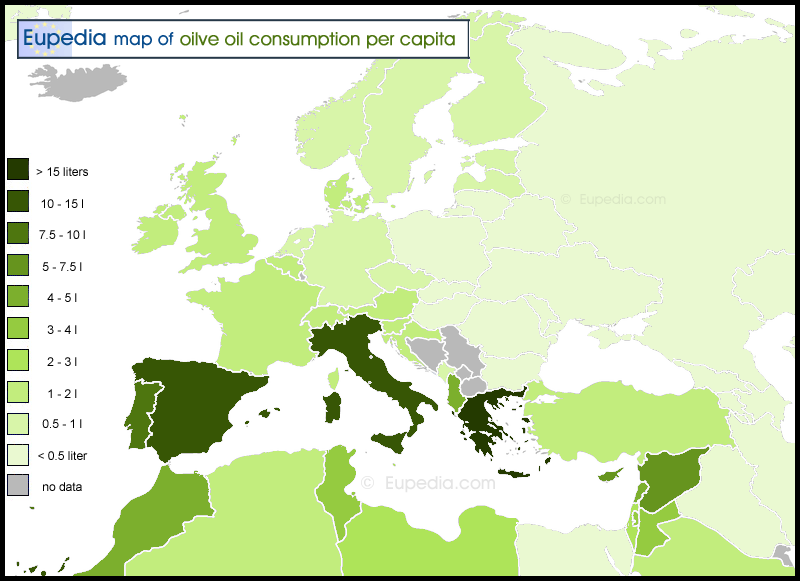
Olive oil consumption per capita in litres per year
This map is based on the data from the International Olive Council for 2013/4.
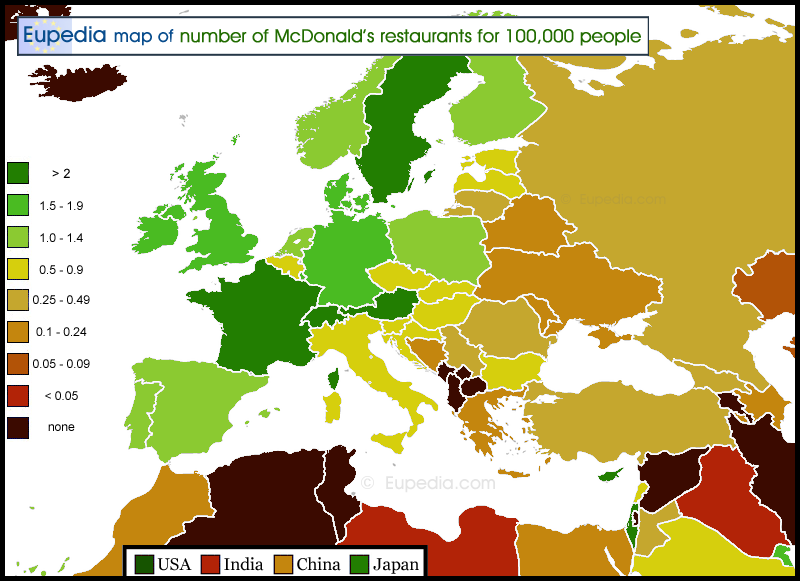
Number of McDonald's restaurants per 100,000 inhabitants
This map is based on the data from Atlasbig.com.
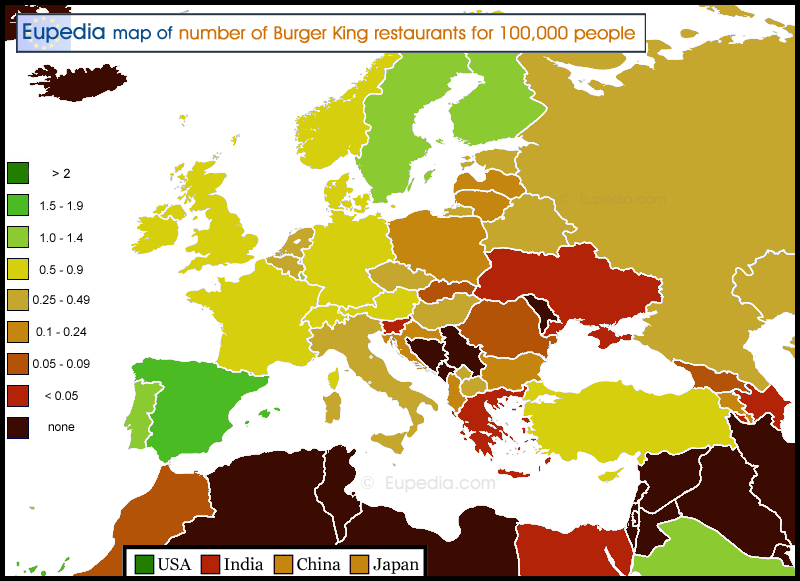
Number of Burger King's restaurants per 100,000 inhabitants
The data for this map was calculated by dividing the number of restaurants in a country by the country's population multiplied by 100,000.
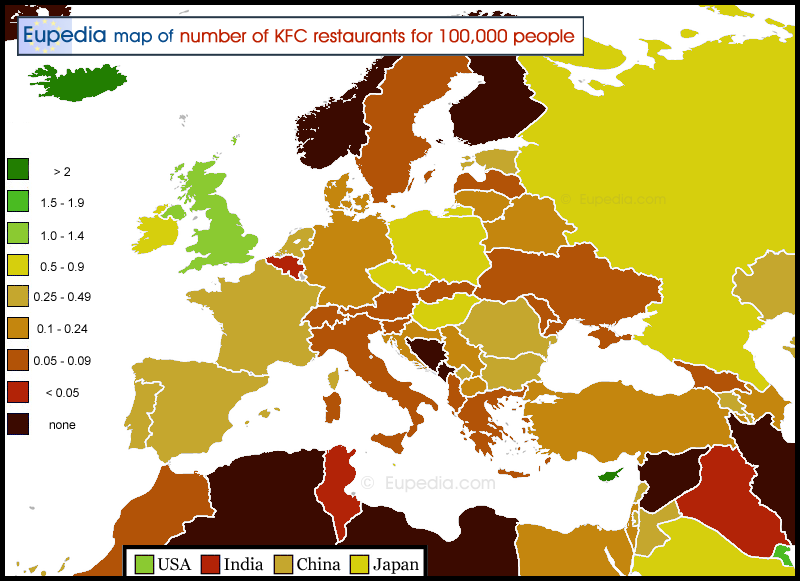
Number of KFC restaurants per 100,000 inhabitants
This map is based on the data from Caribbeansignal.com for 2019. Missing countries was calculated based on the data from the KFC website.
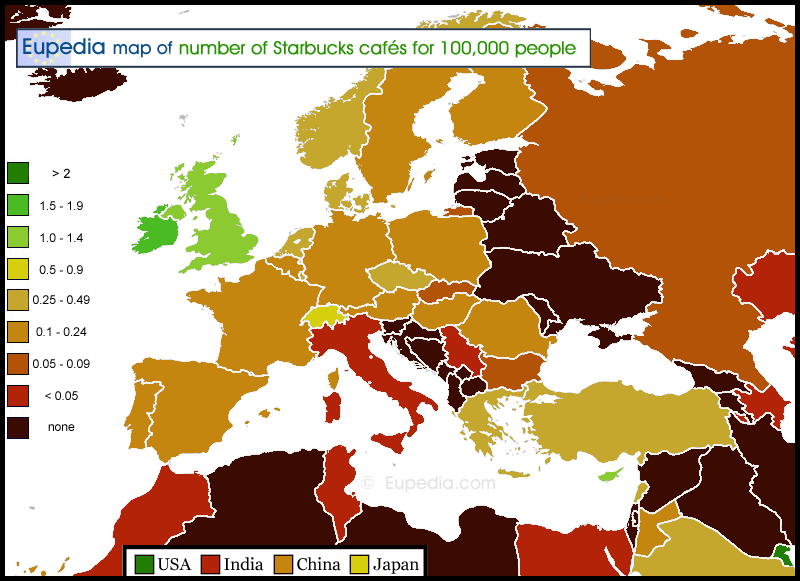
Number of Starbucks cafés per 100,000 inhabitants
This map is based on the data from SilverDoor for 2018. Missing countries was calculated based on the data from the Starbucks website.
And now check
The content of this page is purely indicative and subject to changes, approximations or errors.