Dodecad K12b calculator
The following maps were made based on data from the Dodecad K=12b admixtures. You can see the K12b admixtures of ancient populations and regional evolutions over a period of 15,000 years from the Epipaleolithic to the Middle Ages on the Ancient Ethnicities Analyzer page. You can also easily compare your own results with ancient and modern ones with the Vahaduo tool in link on that page.
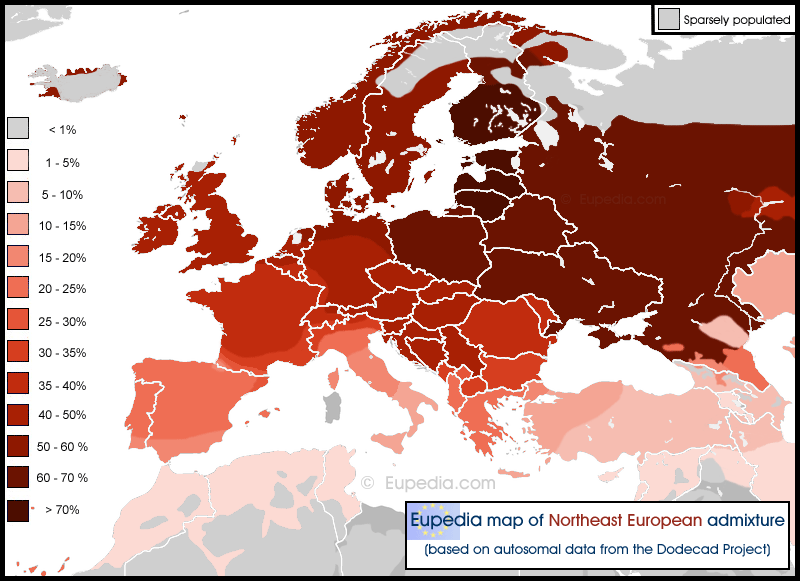
North(east) European admixture
This admixture corresponds roughly to Mesolithic European ancestry. It is inversely correlated with the Atlantic Med admixture below, which matches more Neolithic European farmers. The North European admixture peaks among Baltic people (72~78%), Finns (73~75%) and Saami (59%), but is completely absent from Sardinia. Ancient DNA testing showed that Mesolithic East Europeans scored 78~84% of North_European admixture, Mesolithic West Europeans 63~74%, and Mesolithic Italians 64%. Early Neolithic Anatolians scored 1~3%, Neolithic Greeks 0%, Neolithic Italians 0% (except one outlier who had 11%), Neolithic Balkanians 0~14%, Neolithic Scotland 11%, the Globular Amphora culture 17~26%, and Neolithic Ukrainians 79~84%. During the Bronze Age, samples from the Yamna culture scored 59~64%, those from the Corded Ware culture 55~57%, Minoan Greeks 0%, Mycenaean Greeks 5~9%, North Italian Bell Beakers 7~28%, Bronze Age Spain 20~26%, Bronze Age Britain 33~37%, and the Unetice culture about 49%. Iron Age Latins had 20% to 29% of this admixture (like modern North Italians and South French), while Etruscans had 12% to 25% (like modern Central and North Italians) and Greeks from Italy 10% to 12% (like modern South Italians, Cretans and West Anatolians). Iron Age Anglo-Saxon samples scored 36~37% and pre-Roman Britons 45%.
Distribution of the North(east) European admixture in Europe, the Middle East and North Africa
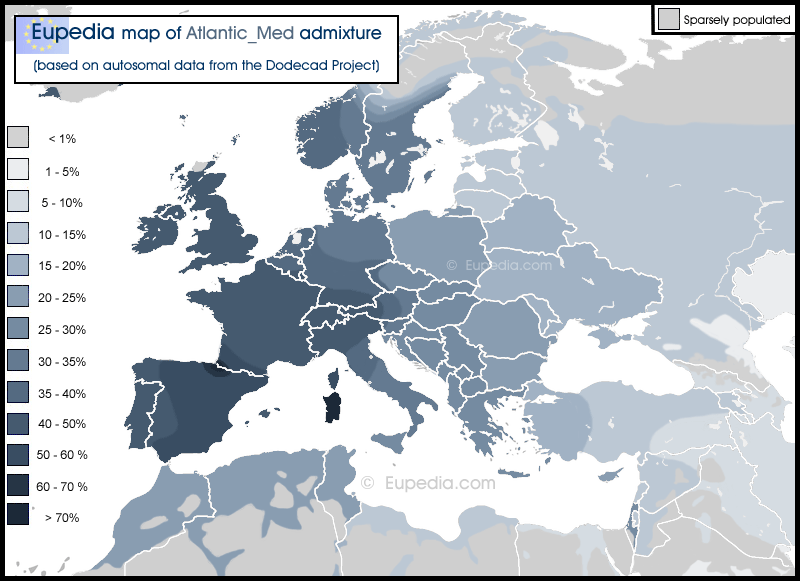
Atlantic Med admixture
This admixture is very similar to the Atlantic above, but is based on the Dodecad K12b calculator instead of the Eurogenes K15. It peaks in the Sardinian and Basque populations and correlates most with the Atlantic Megalithic culture of European Neolithic farmers, who were a fusion of Anatolian farmers and European hunter-gatherers. Mesolithic Western European samples score 23% to 33% of Atlantic_Med admixture. Natufians (Mesolithic southern Levant) score 7~26%, Early Neolithic Anatolians 50~52%, Neolithic Balkans and Carpathians 45~60%, the Globular Amphora culture in Poland 58~69%, the LBK culture 49~57%, Neolithic Greeks 40~45%, and Neolithic Italians 51~66%. This admixture was considerably lower among Mesolithic East Europeans (6% in Mesolithic Ukraine) and consequently also in later periods (3~16% in Neolithic Ukrainians, 2~3% in the Yamna culture), except for the Corded Ware culture (20~32%). In Iron Age Italy, Latins had 47% to 49% of this admixture (like modern Spaniards), while Etruscans had 38% to 47% and Greeks from Italy 21% to 33%.
Distribution of the Atlantic_Med admixture in Europe, the Middle East and North Africa
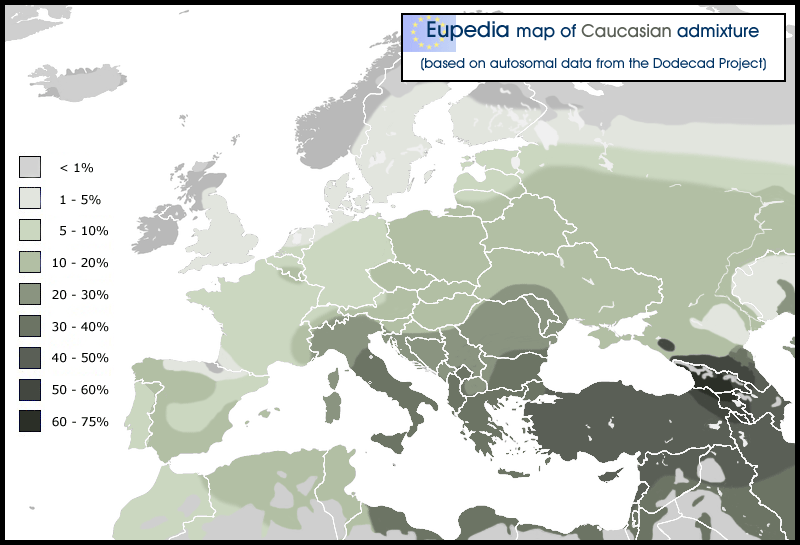
Caucasian admixture
The Caucasian admixture wasn't found among Mesolithic European nor among Proto-Indo-European Steppe people. Early Neolithic Anatolians had about 30~33% of it, Neolithic Greeks 35~41% of it, Neolithic Italians 9~34% (average 28%), Neolithic Balkanians 28~34%, the LBK culture 27~31%, Neolithic Scotland 12%, and the Globular Amphora culture 4~11%. The Caucasian admixture was further propagated by Near Eastern Chalcolithic farmers and the advance of the Kura-Araxes culture from the South Caucasus across the Near East, and their descendants' colonisation of Minoan Greece. Minoan Greeks had 38% to 45% of Caucasian, with one outlier at 22% and another one at 54%. Mycenaean Greeks had just a bit less of it, from 33% to 43%. Later Greeks colonised South Italy thus increasing the Caucasian admixture there. In contrast, Italic and Celtic tribes from Central Europe lowered the percentage of Caucasian when they settled in northern and central Italy. Iron Age Latins had between 13% and 21% of this admixture (like modern Walloons, Andalusians, Galicians and North Slavs), while Etruscans had 18% to 22% (like modern North Italians) and Greeks from Italy 33% to 40% (like modern Central and South Italians, Albanians, Greeks and Turks). Migrations from Italy during the Roman period further helped spread this admixture around Europe.
Distribution of the Caucasian admixture in Europe, the Middle East and North Africa
Gedrosian admixture
The Gedrosian admixture was not found at all in Mesolithic or Neolithic Europeans. Ancient DNA tests confirmed that it was found at high frequencies among Proto-Indo-European people from the Yamna culture (25~30%) and the Corded Ware culture (10~20%), and was spread west with the Indo-European migrations. In Europe it is correlates strongly with the distribution of Y-DNA haplogroup R1b, although its distribution in Asia correlates more with Y-haplogroups G, J2 and L. In the Bronze Age, Minoan and Mycenaean Greeks had 0~4% of Gedrosian, Balkans Europeans 0~21%, Central Europeans 5~11%, and Britons 8~10%. During the Iron Age, Pre-Roman Britons had about 11% of it, Anglo-Saxons 9~11%, Latins 1~5%, Etruscans 0~7%, and Greeks from Italy 6~7%.
Distribution of the Gedrosian admixture in Europe, the Middle East and North Africa

Southwest Asian admixture (K12b)
This admixture was absent from Mesolithic Europe. It originated in the Epipaleolithic southern Levant with the Natufian people who carried 43~55% of this admixture. Early Levantine farmers eventually merged to some extent with Anatolian farmers before spreading agriculture to Europe. The Southwest Asian admixture was found at varying frequencies among European Neolithic farmers: 7~11% in Early Neolithic Northwest Anatolians, 12~14% in Neolithic Greeks, 11~13% in Neolithic Italians, 6~13% in Neolithic Balkanians, 7% in Neolithic Scots. The Proto-Indo-European speakers from the Yamna culture completely lacked this admixture. Minoan Greeks had 5~20% of it, Mycenaean Greeks 7~13%, Bronze Age Balkanians 0~13%, and Bronze Age North Italians 3~9%. Iron Age Latins had 1~5% of this admixture, while Etruscans had 7~11% and Greeks from Italy 11~15%. Note the resemblance with the distribution of Y-DNA haplogroup J1.
Distribution of the Southwest Asian admixture in Europe, the Middle East and North Africa

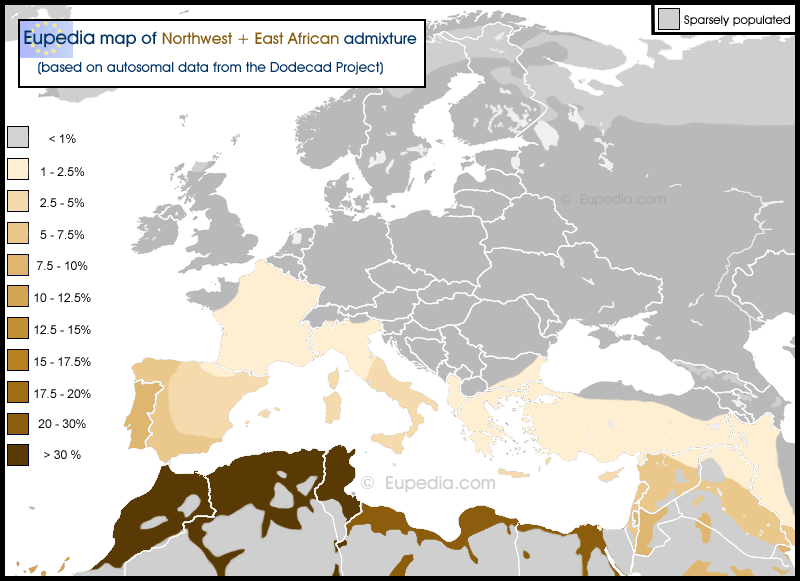
North African admixture (K12b)
This map combines the Northwest African and the East African admixtures. The reason is that both of them are found at varying frequencies throughout North Africa from the Maghreb to Ethiopia and Somalia. Epipaleolihic Iberomaurusians, who lived in Northwest Africa between 25,000 and 9,000 years ago, carried 65.5% of Northwest African and 19% of East African admixture. Modern Moroccans and Algerians have 33% and 17% of them respectively, while Ethiopians have 10% and 40%. The proportion between the two admixtures varies from east to west in a gradient. Modern Egyptians carry approximately 10% of each admixture. The Natufians, who lived around modern Israel, Palestine and Jordan around 15,000 to 11,500 years ago, just before the rise of agriculture in the Fertile Crescent, had 20% of Northwest African and 5% East African. What all these populations have in common is that they belong(ed) primarily to Y-DNA haplogroup E1b1b. One notable exception is the V13 branch of E1b1b, which arose in Neolithic Europe in people whose North African ancestry had already been heavily diluted. If we exclude E-V13, the distribution of North African admixture generally correlates with that of Y-haplogroup E1b1b.
Distribution of the Northwest African + East African admixture in Europe, the Middle East and North Africa
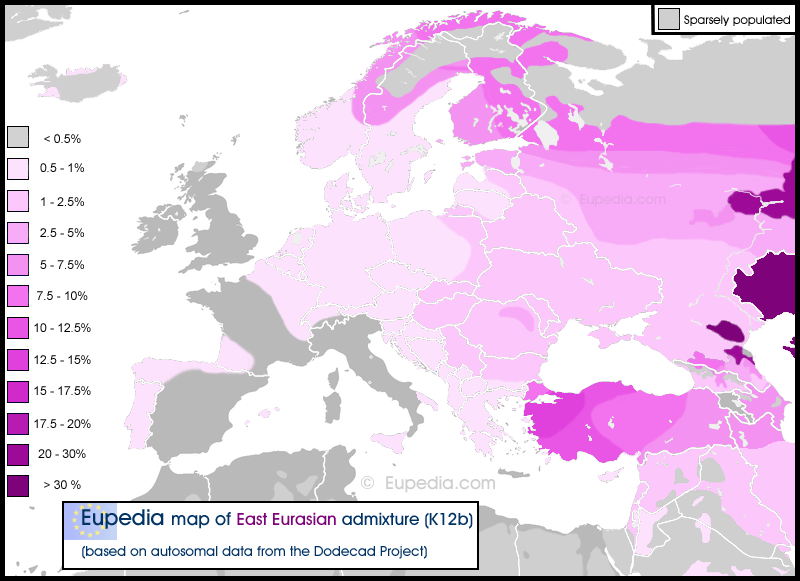
East Eurasian admixture (K12b)
This map combines the three admxitures of Mongoloid origin, namely the Siberian, East Asian and Southeast Asian, which are the three principal components (in varying proportions) of Siberian tribes, Northeast Asian and Southeast Asian people. This East Eurasian admixture has been present in Europe and the Middle East at least since the Epipaleolithic, probably due to the nomadic nature of Siberian tribes and the absence of clear boundaries between Siberia, Europe, Central Asia and the Middle East. The Natufians of the southern Levant already possessed over 2% of East Eurasian, as did Early Neolithic Iranian farmers. Mesolithic Europeans had as little as 0.8% in the Balkans and 1.2% in Western Europe to 3% in Scandinavia and over 6% in Eastern Europe (Russia, Ukraine). Anatolian and European Neolithic farmers had very little East Eurasian ancestry, so the frequency dropped around Europe from about 5500 BCE until the arrival of the Proto-Indo-European speakers from the Pontic-Caspian Steppe descended from the Yamna culture (2.5% of East Eurasian) who spread west through the Corded Ware culture, Unetice culture and the Bell Beaker trade routes from Central Europe to Britain and Ireland, pushing back up the percentage of East Eurasian over 1%. Steppe nomads always carried substantial levels of Mongoloid ancestry. The Cimmerians had 14% of it, the Western Scythians (Ukraine) 7.5%, the Eastern Scythians (Urals, Kazakhstan) 33%, and the Sarmatians 10%. Later the Huns, Avars, Bulgars, Magyars, Mongols and Turks brought additional East Eurasian DNA into Eastern, Central and Southeast Europe and/or the Middle East.
Distribution of the East Eurasian admixture in Europe, the Middle East and North Africa
Dodecad V3 (aka K12) calculator
The following maps were made based on data from the Dodecad K=12 admixtures.
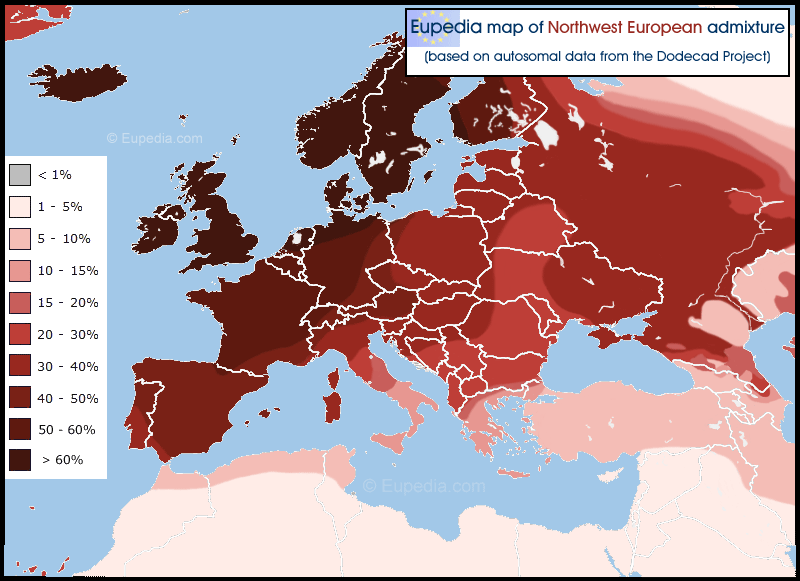
Northwest European admixture
>Note that the 'West European' admixture was renamed 'Northwest European' on Eupedia, as it fits better the overall distribution of this admixture. This admixture was the main component of Mesolithic Europeans (including in the Pontic-Caspian Steppe), making up about two thirds of their genome. It was designed to correlate with the present distribution of haplogroup R1b-L51, representing essentially the Italic, Celtic and Germanic branches of the Indo-Europeans. When merged with the East European admixture below it should correspond roughly to the WHG map above.
Distribution of the Northwest European admixture in Europe, the Middle East and North Africa
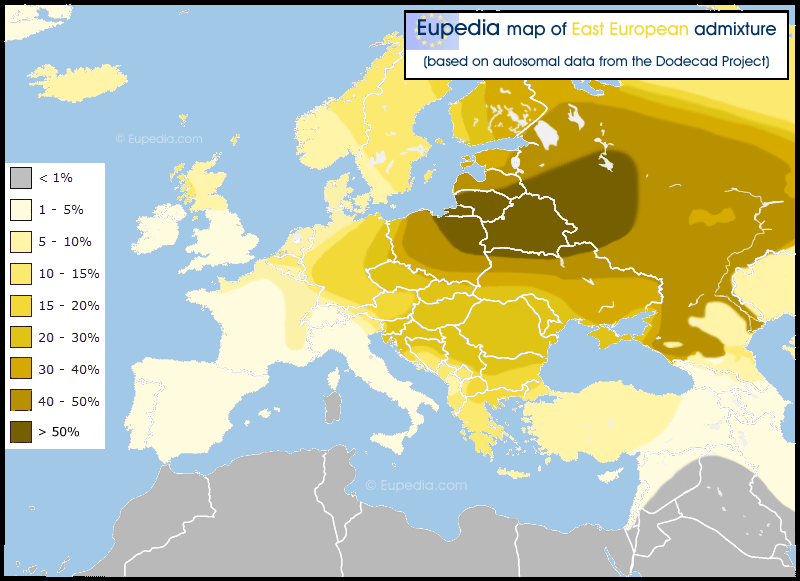
East European admixture
This East European component represents about a third of the Mesolithic European admixture in the Dodecad K12 calculator, the rest being made up of the Northwest European above. Note the resemblance with the distribution of Y-DNA haplogroup R1a.
Distribution of the East European admixture in Europe, the Middle East and North Africa
Mediterranean admixture
The Mediterranean admixture was was brought by Near Eastern Neolithic farmers and peaks in the Sardinian population today. It is similar to the EEF map above, but probably contains some Mesolithic North African and South European ancestry (Y-DNA E-M78, mtDNA H and V) not included in the WHG, Northwest European and East European admixtures above. That would explain why it is higher around the Mediterranean than in the Near East. The Mediterranean admixture was not found in any Mesolithic Central or North European, nor in the Yamna and Afanasievo cultures in the Eurasian Steppe. However, both the Corded Ware and Sintashta people possessed about 10-15% of it, probably inherited by the Corded Ware people by intermingling early with Neolithic Europeans (e.g. Cucuteni-Trypillian) soon after leaving the Pontic Steppe.
Distribution of the Mediterranean admixture in Europe, the Middle East and North Africa

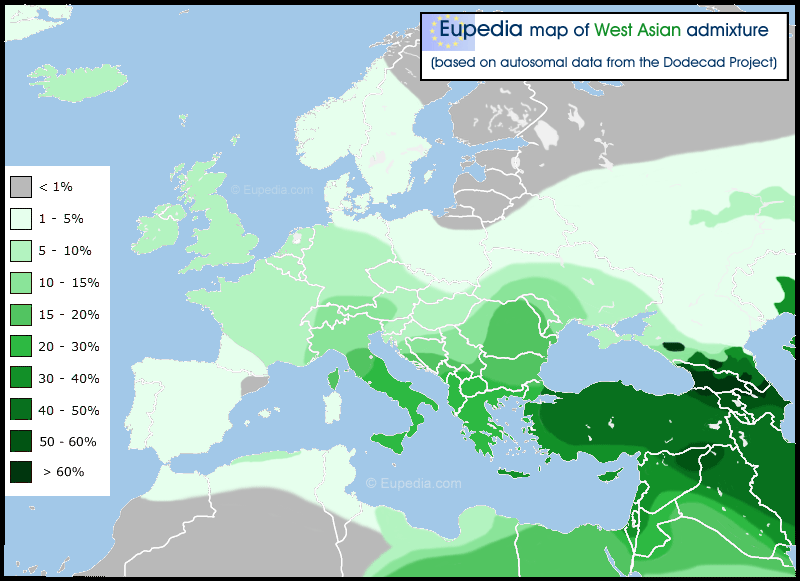
West Asian admixture
This admixture seems to have originated around the Caucasus and the Iranian plateau. It was absent in Neolithic European farmers, but starts appearing at low frequency in Chalcolithic farmers in the Balkans and Central Europe (including Ötzi the Iceman). Most of it was probably propagated to southern Europeby by Late Bronze Age and Early Iron Age expansions from the Middle East, including the Minoan Greeks and the Etruscans, then again later by migrations from the Near East to Southeast Europe within the Roman, Byzantine and Ottoman Empires. Some of it would have been spread by the Romans around western Europe. Note the resemblance with the distribution of Y-DNA haplogroup J2.
Distribution of the West Asian admixture in Europe, the Middle East and North Africa
Southwest Asian admixture (K12)
This admixture was found at low frequency among European Neolithic farmers, and possibly at much higher frequency among South Levantine and North African Neolithic farmers. The higher levels of Southwest Asian admixture in Sicily, Sardinia and southern Spain are due to the Phoenician colonisation in ancient times and the Arab invasions in the Middle Ages.
Distribution of the Southwest Asian admixture in Europe, the Middle East and North Africa

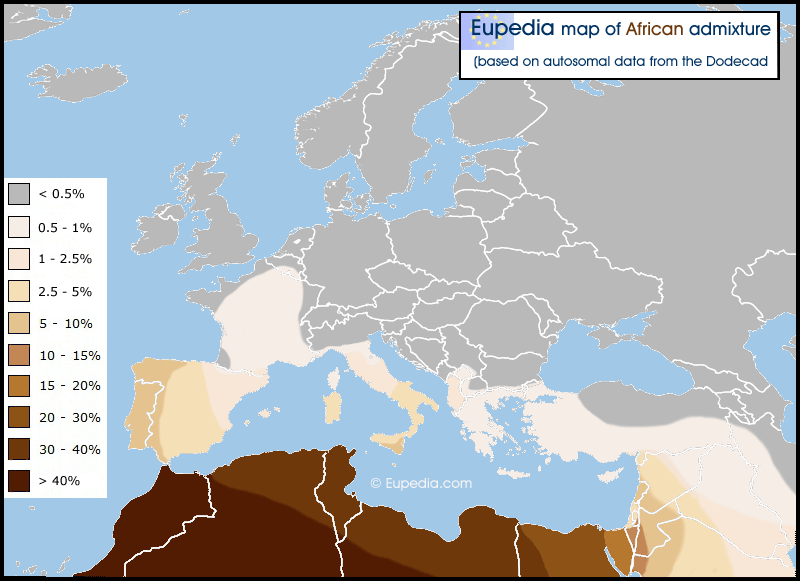
African admixture
The African admixture was computed by adding up the Northwest African, East African, Neo African and Paleo African components, which were too minor in Europe on their own. African admixture was found among Neolithic farmers, and especially those from the southern Levant, who assimilated the Mesolitic Natufians (confirmed to belong to Y-haplogroup E1b1b). The Neolithic farmers who carried the most African admixture to Europe were those who followed the southern route via North Africa, then spreading from Spain to western Europe with the Megalithic cultures. Some individuals from the Funnelbeaker culture in Scandinavia, which derives partly from the Atlantic Megalithic, carried as much as 11% of this African admixture. It subsisted at lower frequency in Scandinavia at least until the Late Iron Age. Later, the Phonenician/Carthagenian colonisation, then the Arab conquest of the Iberian peninsula and of Sicily brough additional North African DNA to southern Europe. This admixture is essentially a Northwest African, but contains some Sub-Saharan African too, like in North Africa itself. Note the resemblance with the distribution of Y-DNA haplogroup E-M81.
Distribution of the African admixture in Europe, the Middle East and North Africa
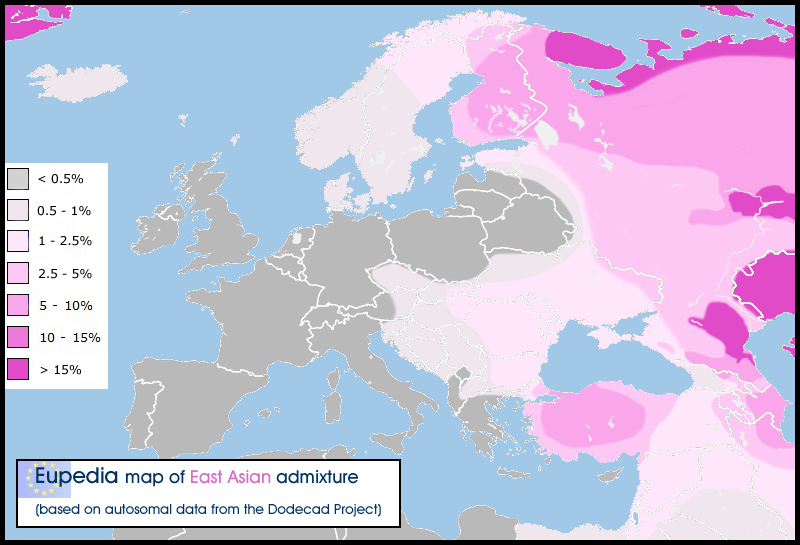
East Asian admixture
The East Asian admixture combines Northeast Asia and Southeast Asia. This admixture was brought to Europe by Mongoloid people via Siberia. Some of it was already present in Russia during the Mesolithic period, but the largest East Asian migration to Europe took place with the arrival of Proto-Uralic people during the Neolithic. They originated in Manchuria and carried Y-haplogroup N1c. North Siberian Y-haplogroup Q1a (which is also the main paternal lineage of Amerindians) was also found in the Proto-Indo-European Khvalynsk culture in the Pontic-Caspian Steppe, the precursor of the Yamna culture. Since then, 5000 years of migrations from the Steppe brought wave upon wave of Siberian invaders to Eastern Europe and the northern Middle East. The most recent of them were the most Mongoloid as populations shifted from east to west. They included the Huns, the Bulgars, the Magyars, the Turks and the Mongols.
Distribution of the East Asian admixture in Europe and the Middle East
Dodecad K10a calculator
The Red Sea map was made with data from the Dodecad K=10a admixtures.
Red Sea admixture
The Red Sea admixture peaks in Ethiopia and Somalia, the region of origin of Y-DNA haplogroup E1b1b, to which its distribution is closely linked, except in northwestern Europe.
Distribution of the Red Sea (Horn of Africa) admixture in Europe, the Middle East and North Africa

Eurogenes EEF-WHG-ANE calculator
These three admixtures represent the three ancestral populations identified by Iosif Lazaridis et al. (2014) in their landmark paper Ancient human genomes suggest three ancestral populations for present-day Europeans. The three populations are the Early European Farmer (EEF), Ancient North Eurasian (ANE) and West European Hunter-Gatherer (WHG). As data from the paper was not available for many countries, the maps were based on Eurogenes's EEF-WHG-ANE calculator, which gives close but not identical results.
Early European Farmer (EEF) admixture
This map compares the genes of modern people to the DNA of a Neolithic individual from Stuttgart in Germany, who lived 7,500 years ago. The Neolithic sample was tested by Lazaridis et al. (2014). It is supposed to reflect the percentage of similarity with Neolithic farmers who colonised Europe from the Near East. The closest modern populations are the Ashkenazi Jews (93%), Maltese (93%) and Sicilians (90%).
Distribution of the Early European Farmer (EEF) in Europe, the Middle East and North Africa

Ancient North Eurasian (ANE) admixture
This map compares the genes of modern people to the DNA of a Central Siberian mammoth hunter (known as MA-1), who lived 24,000 years ago and belonged to Y-DNA haplogroup R* and mtDNA haplogroup U*. The Paleolithic sample was tested by Raghavan et al. (2014). This admixture was absent from Mesolithic European samples, except in Scandinavia and Eastern Europe, and was completely absent from all Neolithic European samples tested to date. It is thought to have been spread across Europe and the Middle East by the Proto-Indo-Europeans (Y-haplogroups R1a and R1b) from the Pontic-Caspian Steppe, and to a lower extent also by Uralic people (Finns, Estonians, Magyars) and Turkic people (Avars, Bulgars, Khazars, Kurds, Turks). The ANE admixture is particularly common today among North Caucasian and Volga-Ural ethnicities, who live in regions strongly associated with the development of Proto-Indo-European cultures in the Early Bronze Age. Within Europe, the highest percentages of ANE admixture are observed among the Lezgins (26.5%), Chechens (26%), North Ossetians (23.5%) Kumyks (23.5%), and Adyghei (22.5%). Frequencies of over 20% of R1b have been found among the Lezgins, Kumyks and North Ossetians.
Distribution of the Ancient North Eurasian (ANE) admixture in Europe, the Middle East and North Africa

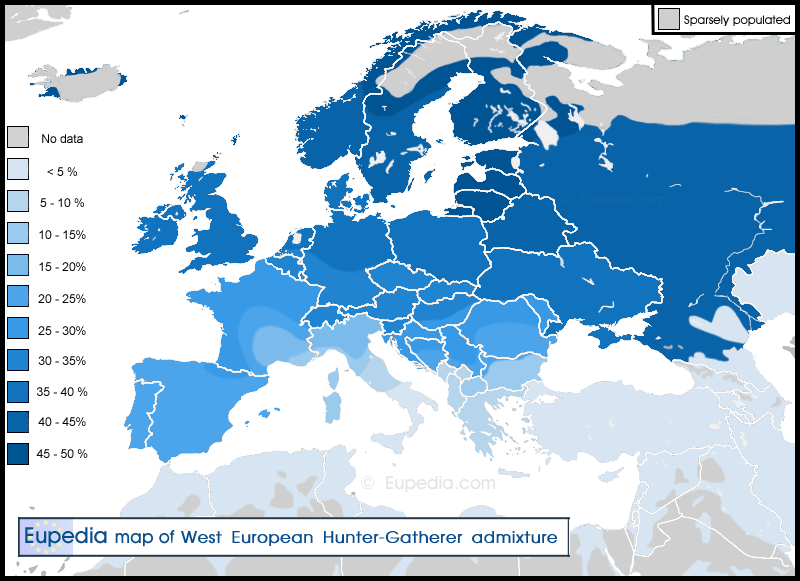
West European Hunter-Gatherer (WHG) admixture
This map compares the genes of modern people to the DNA of a Mesolithic hunter-gatherer from the Loschbour cave in Luxembourg, who lived 8,000 years ago and belonged to Y-DNA haplogroup I2a1b and mtDNA haplogroup U5b1a. The sample was tested by Lazaridis et al. (2014). It is supposed to reflect the percentage of similarity with the Late Upper Paleolithic and Mesolithic inhabitants of Western Europe. Nowadays this admixture peaks among the Estonians (49.5%), Finns (47%), Lithuanians (46.5%), Icelanders (45.5%) and Orcadians (45.5%).
Distribution of the West European Hunter-Gatherer (WHG) in Europe, the Middle East and North Africa
Eurogenes K15 calculator
This map was made based on data from Eurogenes K15.
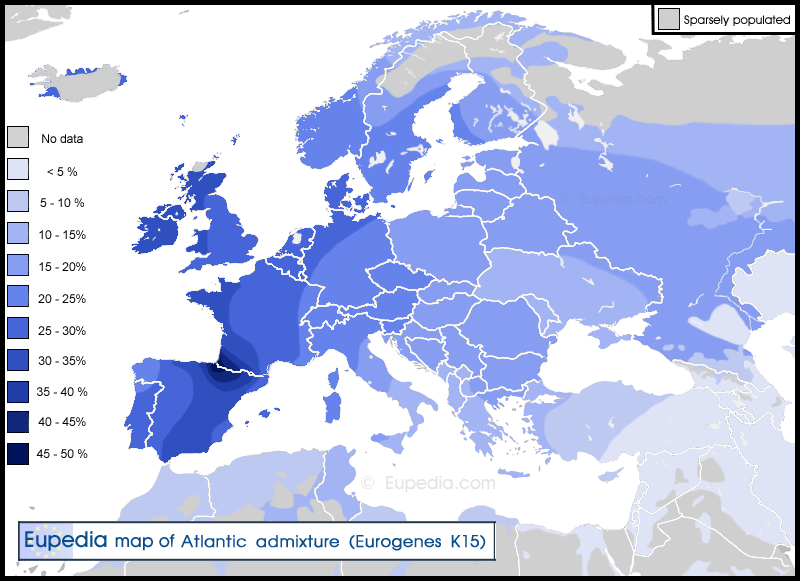
Atlantic admixture
This admixture peaks in the Basque population and appears to be a blend of Near Eastern Neolithic farmers and Mesolithic European Hunter-Gatherers. It matches mostly the extent of the Atlantic Megalithic culture. Several ancient samples were added to GEDMatch and analysed with Eurogenes K15. Nine Megalithic Iberian samples (3211-1518 BCE) had an average Atlantic percentage of 38.8%, similar to modern Basques. Three samples from the Remedello culture in Late Neolithic northern Italy (3483-1773 BCE) scored an average of 35.2%, considerably more than modern Italians, even Sardinians. One Megalithic Irish sample from Ballynahatty had 32.7% of Atlantic, about the same as modern Irish people.
Distribution of the Atlantic admixture in Europe, the Middle East and North Africa
23andMe Ancestry Composition
The following maps were made using customers's data for 23andMe's Ancestry Composition (before it was revised to more recent ancestry around 2019). Whereas the Dodecad and Eurogenes admixtures tried to capture prehistoric ancestry reflecting the populations that merge with one another from the Mesolithic period to the Bronze Age (c. 12,000 to 2,500 years ago), 23andMe focuses on more recent ancestry from the Iron Age to the Early Medieval period c. 2,500 to 1,000 years ago). As a result the admixtures are more geographically restricted. Note that the not enough data was available to accurately represent regional percentages in Spain, France, Germany or Poland. Samples from Lapland and several Slavic countries were eiher missing or scarce in our database. If you come from an undersampled region and tested with 23andMe, feel free to share your Ancestry Composition here.
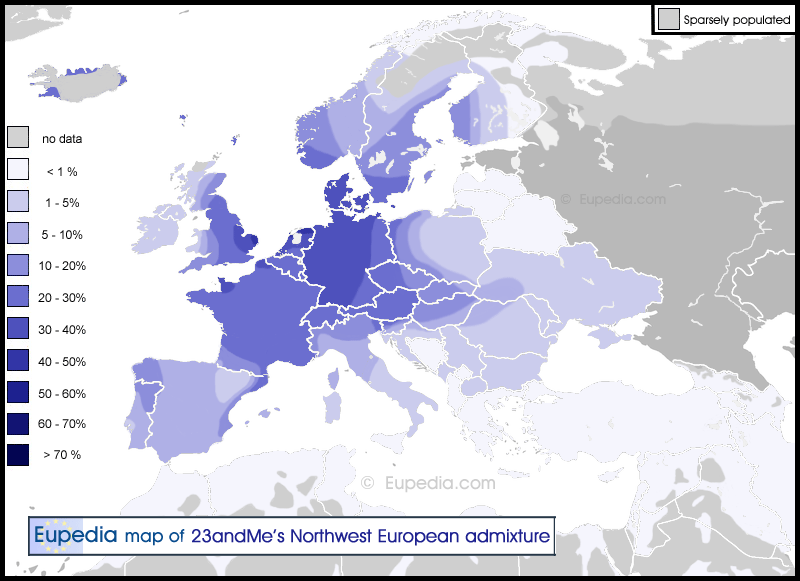
Broadly Northwest European admixture
This admixture peaks in the northern Dutch provinces of Frisia and Groningen (40%), as well as in East Anglia (35-40%), Denmark (34%), the central Netherlands (32%), Germany (31%) and the northern French département du Nord (31%) and the Cotentin peninsula in Normandy (33%). Its distribution correlates mostly with West Germanic ancestry, but could also include some broader Celto-Germanic elements in Germany, the Benelux and France. It appears to be linked to the Proto-Celto-Germanic Y-haplogroup R1b-U106, which almost reaches its maximum frequency in Frisia, East Anglia and Denmark. The higher percentage in northern Portugal and Galicia can be attributed to the Suebi settlements in the early Middle Ages.
Distribution of the Broadly Northwest European admixture in Europe
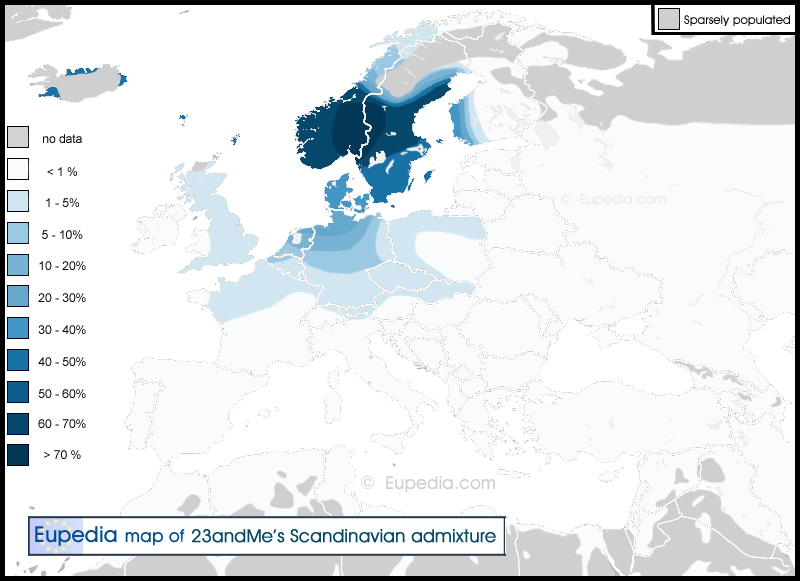
Scandinavian admixture
This admixture represents relatively recent Scandinavian admixture (less than 2,000 years). During the Migration period, Germanic tribes that originated in Scandinavia would have carried more of it than North German and Dutch tribes like the Anglo-Saxons, Franks and Lombards. Places settled by the Vikings tend to have slightly higher percentages.
Distribution of the Scandinavian admixture in Europe
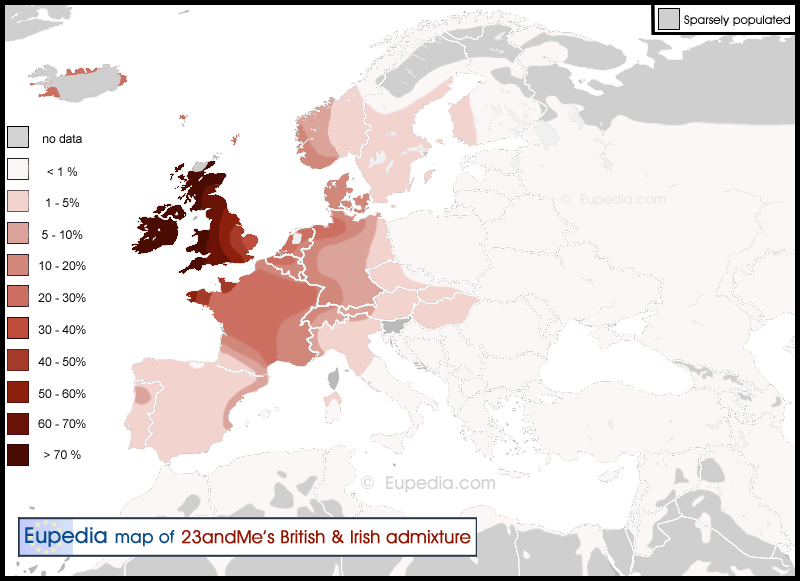
British & Irish admixture
This admixture appears to have been created by combining the Insular Celtic (ancient Gaelic and Brythonic) ancestry linked to Y-haplogroup R1b-L21 with the specifically Anglo-Saxon and Frisian clades of Y-haplogroup R1b-U106. However this admixture is found everywhere in Western Europe, from Iberia to Scandinavia and could be described as broadly Celto-Germanic. In other words it includes Indo-European DNA brought by the R1b migrations in the Bronze Age minus the admixture from the French & German and the Broadly Northwest European. Since almost all Irish ancestry is either Insular Celtic or Anglo-Saxon, it reached a maximum frequency of 95% in Ireland (and possibly in Wales too). The higher frequency in the Netherlands and Northwest Germany, and the presence in northern Italy and northern Sardinia suggests that this admixture was also found among the Anglo-Saxons and Lombards. The high frequency in France could also be due to a dual Celto-Germanic origin.
Distribution of the British & Irish admixture in Europe
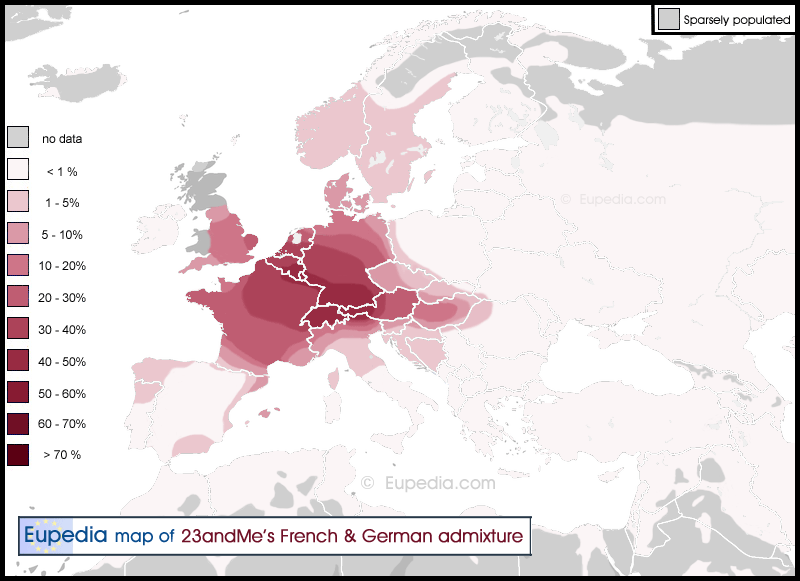
French & German admixture
This admixture could represent ancient Alpine Celtic ancestry from the Hallstatt and La Tène cultures, perhaps mixed with some Germanic ancestry (notably Frankish and Alemani/Suebi). It peaks in Switzerland (max. 65%) and Wallonia (max. 70%), which were the two centres of the La Tène culture. The map matches fairly well the distribution of Celtic branches of Y-haplogroup R1b-U152 (once Italic ones are removed).
Distribution of the French & German admixture in Europe
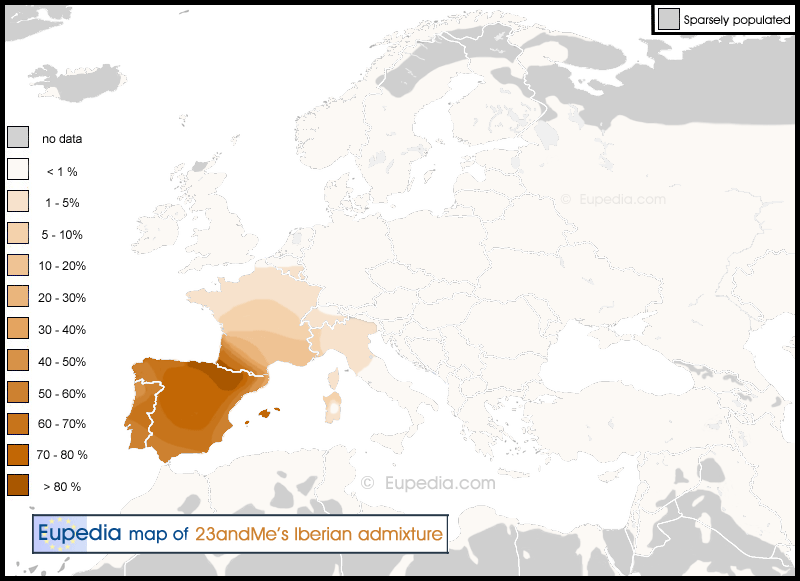
Iberian admixture
This admixture peaks among the wider Basque region, including former Basque speakers in Navarra and Aragon. It is found at a high percentage throughout the Iberian peninsula, but is generally lower in western Iberia and along the Mediterranean coast, where many non-Iberian people have settled throughout history (Phoenicians, Hallstatt Celts, Greeks, Romans, Suebi, Vandals). It is also common among Occitan speakers in the southern half of France, surely due to the Neolithic connection with the Iberian peninsula.
Distribution of the Iberian admixture in Europe
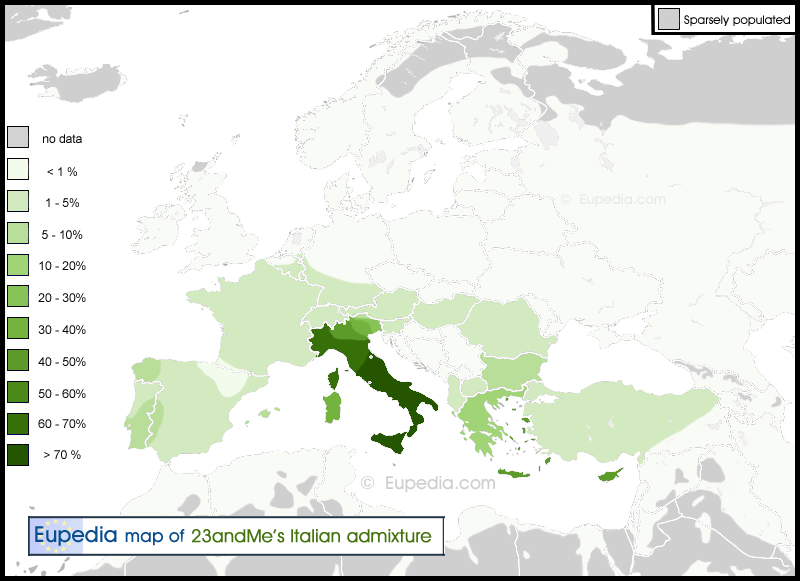
Italian admixture
This map has a distribution that seems to include mostly the non-Celtic/Germanic ancestry in Italy. Despite the heavy ancient Greek colonisation of southern Italy, this admixture is quite distinct from the Greek one, except in the Aegean Islands, Anatolia and Cyprus, where 23andMe doesn't seem to distinguish between Italian and Greek ancestry. This is because insular Greeks are very close genetically from South Italians. This admixture seems to be found exclusively within the boundaries of the Roman Empire, and consequently might well have been spread outside Italy/Greece by the ancient Romans. The hotspots in Galicia and central/southern Portugal can be explained by the high percentage of Roman colonies in those regions, but also perhaps by the displacement of the substantial Roman population from western Andalusia to Portugal over the centuries.
Distribution of the Italian admixture in Europe
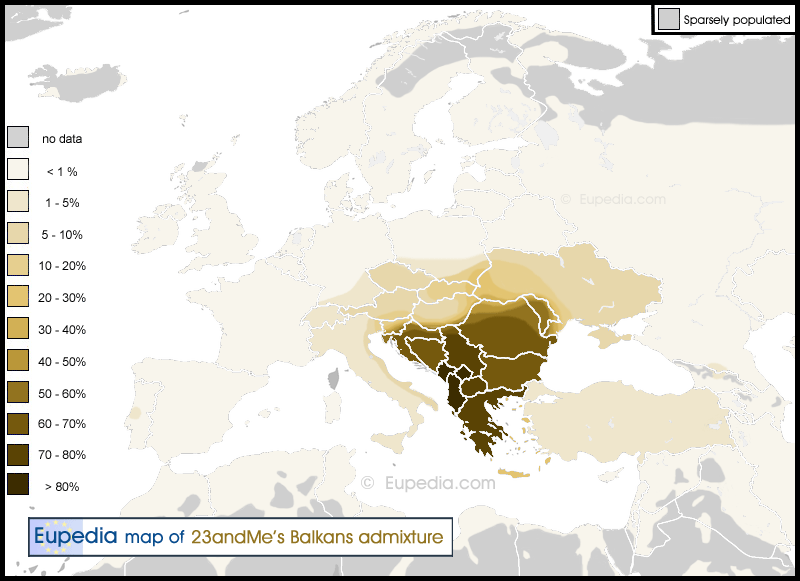
Balkans admixture
Distribution of the Balkans admixture in Europe
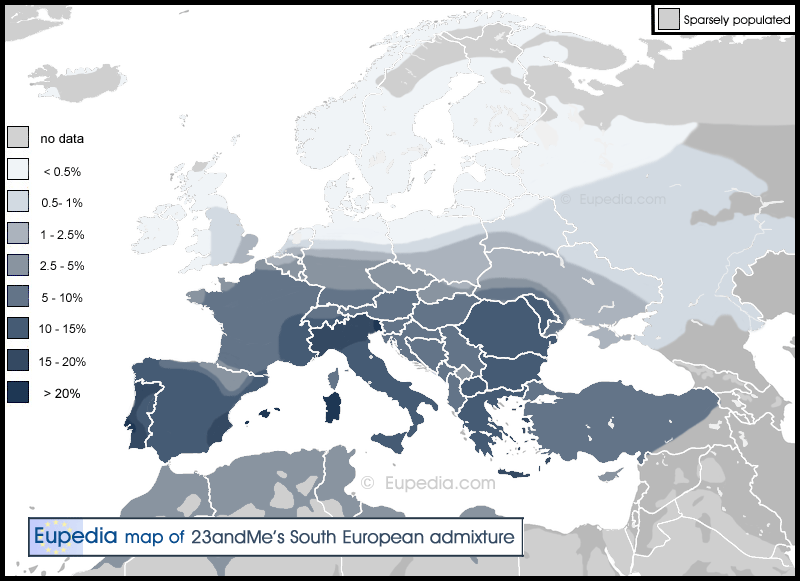
Broadly South European admixture
Distribution of the Broadly South European admixture in Europe
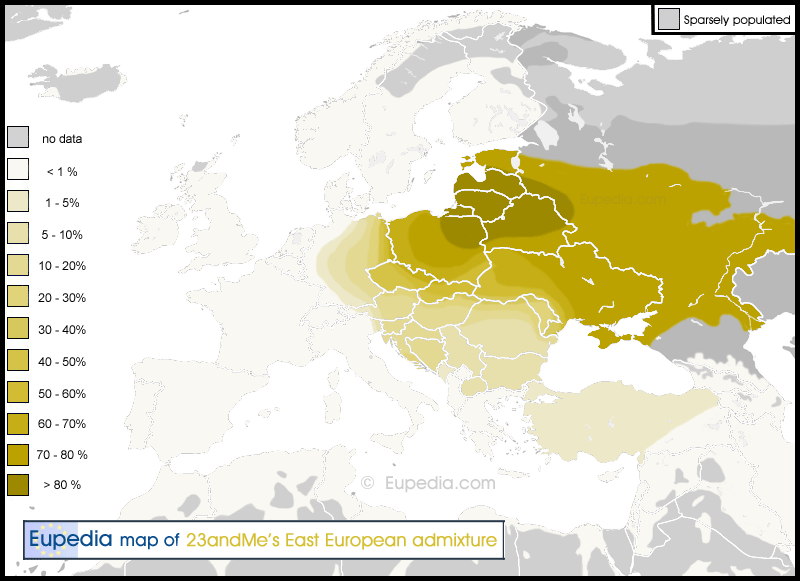
East European admixture
This admixture corresponds fairly well to Slavic and Baltic ancestry related to Y-haplogroup R1a-M458 and R1a-Z280. There is gradient in the Balkans that also macthes that of haplogroup R1a, although the autosomal admixtures fall more quickly with distance from the Slavic homeland.
Distribution of the East European admixture in Europe
| Comparing maps of autosomal DNA with Y-DNA haplogroups |
|---|
|
It is tempting to make analogies between the distribution of autosomal admixtures and that of Y-DNA haplogroups. While both of them represent the migrations of certain populations and may roughly correspond to the same source populations, it is essential to understand that any correspondance has its limits for a number of reasons.
- Whereas Y-chromosomal lineages can be organised in a neat genealogical tree ('phylogenetic tree' is the technical word), it is much harder for autosomes due to the fact that they get mixed up ('recombined') at every generation with other autosomes. To trace back the origins of a population, the idea is to check which modern populations share the same unique mutations spread out on all 22 pairs of non-sex chromosomes. That's why they are referred to as "admixtures". The names for each admixture are arbitrary and do not necessarily refer to the source population who spread those genes, but usually the geographic region where it is most common today. For example, the Southwest Asian admixture got its name because this set of mutations is most common in the Arabian peninsula nowadays. But Arabic people descend from nomadic herders who lived around the Zagros and Taurus mountains, around northern Mesopotamia, during the Neolithic period. This is also the case of Y-haplogroup J1, with which the Southwest Asian admixture best correlates. In other words, the so-called Southwest Asian admixture found in a European individual may never have come from Southwest Asia (Arabic peninsula) at all, but rather from Anatolia.
- Any admixture can be broken down into a number of more specific admixtures, splitting populations that may otherwise have looked closely related. The Northwest European admixture almost certainly comprises DNA markers from two completely different source populations. That is why it is found at high frequencies among the Finns, the Irish and the Iberians, three populations that do not share a lot in common history or phenotypes. It is also found at lower but still substantial frequencies in the Chuvash people (22%) from the Volga region, and the Adygey people (16%) from the North Caucasus, and the Uyghur people (10%) from Northwest China. In all likelihood, the Northwest European component is composed of markers belonging to the Paleolithic population of northern and western Europe (haplogroup I), as well as an Indo-European element (haplogroup R1b) that originated in the Black Sea region.
- The way Y chromosomes and autosomes are transmitted is very different. Y chromosomes are strictly inherited from fathers to sons and never recombine, while autosomes are inherited at 50% through each parent. This will inevitably affect their respective geographic distribution since it is known that in most European societies through the ages male children (usually the eldest sons) were the ones who inherited the land, house, farm or even castle from their parents, and therefore stayed from generation to generation at the same place. Women, on the contrary, were married off to men from neighbouring tribes, villages or towns. They were sometimes sent quite far away, especially in royal and noble families that frequently used daughters to seal alliances with other families, or just sought a suitor of a similar social level which they could not find close to home (or at least not without risking inbreeding). This is still common practice among the high aristocracy nowadays. This explains why maternal lineages (mtDNA) and autosomal DNA is much more evenly spread out geographically than paternal lineages (Y-DNA).
- Y chromosomes sometimes disappear for evolutionary reasons. Mutations in one lineage can have a negative incidence on male fertility, causing men to have more female offspring (who do not pass on Y-DNA), have less children (contraction of the Y-DNA lineage), or in extreme cases even become sterile (extinction of the Y-DNA lineage).
- Y chromosomes may suffer dramatic decline in frequency due to wars, in the event men from a tribe or ethnic group are killed in large numbers by their opponents, and their women taken by the winners. Since autosomes are also passed on by women, autosomes would survive such a scenario even if all male lineages went extinct (which was probably very rare, but once in history is enough to affect a region permanently).
|
Follow-up
Ask your questions and discuss about haplogroups on the Forum