Eupedia
Eupedia Genetics


Eupedia Home > Genetics > Frequencies of European Y-DNA haplogroups by region

Distribution of European Y-chromosome DNA (Y-DNA) haplogroups by region in percentage

Last update : June 2017 (revised Cyprus, Czech Republic, Romania and Iran)
Tip : You can now access this page by typing directly ydna.eu into your browser.

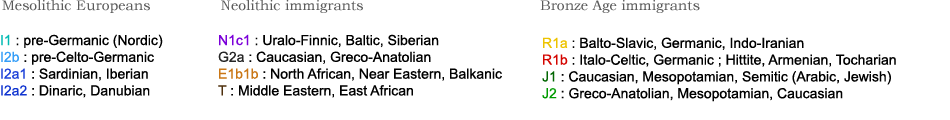
Human Y-chromosome DNA can be divided in genealogical groups sharing a common ancestor. These are called haplogroups. To know what ancient ethnic group is associated with each haplogroup, please check European Haplogroups : origins, geographic spread and relation to ethnic groups.

Note that figures are only indicative. Several sources were used and averages recalculated by merging the data available. Being approximations, numbers were rounded up to 0.5%. Frequencies inferior to 0.25% are indicated as 0%. A non-exhaustive list of the sources used for this page can be found here.

Ethnicities by haplogroup (simplified - subclades used for specifics)


=> Sort all countries alphabetically

North-Western Europe

Region/Haplogroup I1 I2a I2b R1a R1b G2a J2 J1 E1b1b T Q N1c1 Sample size
Belgium 12 2.5 5 4 59.5 4 2.5 0.5 7 1 0 0 876
England 14 2.5 4.5 4.5 67 1.5 3.5 0 2 0.5 0.5 0
France 8.5 3 3.5 3 58.5 5.5 6 1.5 7.5 1 0.5 0 2565
  • Alsace
  • 8 1 3 3 55 6 8 1 10 4 1 0 102
  • Brittany
  • 8 1 4.5 0.5 80 2 2.5 0.5 0.5 0 0 0 115
  • Flanders-Artois
  • 13 2.5 1 2.5 61 6 2.5 0 12 0 0 0 85
  • Ile-de-France
  • 2.5 2 2 3.5 57.5 3.5 6.5 1 20.5 0 0 111
  • Normandy
  • 7 4 2 1 76 0 2 1 5 0 1 0 95
    Ireland 6 1 5 2.5 81 1 1 0 2 0 0 0
    Netherlands 16.5 1 6.5 4 49 4.5 3.5 0.5 3.5 1 0 0 748
    Scotland 9 1 4 8.5 72.5 0.5 2 0 1.5 0.5 0.5 0
    Wales 12 1 3 1 74 2.5 0.5 0 4 1 0 0 411

    South-Western Europe

    Region/Haplogroup I1 I2a I2b R1a R1b G2a J2 J1 E1b1b T Q N1c1
    France 8.5 3 3.5 3 58.5 5.5 6 1.5 7.5 1 0.5 0
  • Auvergne
  • 2 1 1.5 5.5 52.5 9 8 3.5 12.5 4.5 0 0
  • Corsica
  • 0 18.5 1 0 49 7.5 14 0 8 0.5 0 0
  • Midi-Pyrénées
  • 2.5 5 2.5 4 61 4 8.5 4 7.5 1 0 0
  • Poitou-Saintonge
  • 1.5 3 0 0 74.5 7.5 6 0 1.5 0 0 0
  • Provence
  • 2 4 1 5 58 7.5 8.5 1 10.5 1 2 0
    Italy 4.5 3 2.5 4 39 9 15.5 3 13.5 2.5 0 0
  • North Italy
  • 7 1 3.5 4.5 49.5 7.5 10 1.5 11 2 0 0
  • Tuscany
  • 4 1.5 2.5 4 52.5 9 11.5 2 9 2 0 0
  • Central Italy
  • 2.5 2 1.5 3 36 11 23 5 11.5 3 0 0
  • South Italy
  • 2.5 3.5 1 3 27.5 10.5 21.5 4 18.5 2.5 0 0
  • Sicily
  • 3.5 3 1 4.5 26 8.5 23 3.5 20.5 4 1 0
  • Sardinia
  • 0 37.5 2 1 18.5 12 9 4 9.5 1.5 0 0
    Malta 1 10 1 3.5 32.5 6.5 21 8 9 4.5 1 0
    Portugal 2 1.5 3 1.5 56 6.5 9.5 3 14 2.5 0.5 0
    Spain 1.5 4.5 1 2 69 3 8 1.5 7 2.5 0 0
  • Andalusia
  • 0 9.5 0 3.5 58.5 3 10.5 2 10 3 0 0
  • Aragon
  • 2 14.5 1 2 60.5 1 10.5 0 5 4 0 0
  • Asturias
  • 2 2 0 2.5 58.5 8 8 2 14 3 0 0
  • Basque country
  • 0 9 0 0 86 0 2.5 1 1 0 0.5 0
  • Cantabria
  • 1 3 2 8.5 55 10.5 3 2.5 11 2.5 0 0
  • Castile & Leon
  • 0.5 2 0.5 3 64 5 6 1 16 2 0 0
  • Castile-La-Mancha
  • 1.5 1.5 0.5 1.5 66 8 10 4 5 2 0 0
  • Catalonia
  • 2 3.5 1.5 1.5 66.5 4.5 7.5 1.5 8.5 1 0 0
  • Extremadura
  • 3.5 5 1 0 50 5 11.5 0 18.5 5 0 0
  • Galicia
  • 5 3.5 2 1 57 4 10.5 4 10.5 2 0 0
  • Valencia
  • 3 5.5 1 3 63.5 1 6 2 13.5 1.5 0 0

    Northern Europe

    Region/Haplogroup I1 I2a I2b R1a R1b G2a J2 J1 E1b1b T Q N1c1 Sample size
    Denmark 34 2 5.5 15 33 2.5 3 0 2.5 0 1 1 613
    Estonia 15 3 0.5 32 8 0 1 0 2.5 3.5 0.5 34
    Finland 28 0 0.5 5 3.5 0 0 0 0.5 0 0 61.5 1856
    Iceland 29 0 4 23 42 0 0 0 0 0 1 1 181
    Latvia 6 1 1 40 12 0 0.5 0 0.5 0.5 0.5 38
    Lithuania 6 6 1 38 5 0 0 0 1 0.5 0.5 42
    Norway 31.5 0 4.5 25.5 32 1 0.5 0 1 0 1 2.5 2826
    Lapland (Saami) 27 0 0 13 7 0 0.5 0 0.5 0 0 53 262
    Sweden 37 1.5 3.5 16 21.5 1 2.5 0 3 0 2.5 7 2206

    Central Europe

    Region/Haplogroup I1 I2a I2b R1a R1b G2a J2 J1 E1b1b T Q N1c1 Sample size
    Austria 12 7 2.5 19 32 7.5 9 1 8 1 0.5 0.5
    Croatia 5.5 37 1 24 8.5 2.5 6 1 10 0.5 1 0.5 1325
    Czech Republic 7.5 8.5 3 33 28 5 4 1 6.5 0.5 0 2.5 2005
    Germany 16 1.5 4.5 16 44.5 5 4.5 0 5.5 1 0.5 1
  • North Germany
  • 18.5 0.5 7.5 22 36 3.5 4 0.5 2.5 1 2 1.5
  • East Germany
  • 16.5 1.5 5 24 36 4 2 0 7.5 1 1 1
  • West Germany
  • 12.5 2.5 6.5 9 47 5 5 0 8 1.5 0.5 2
  • South Germany
  • 10.5 4.5 3 9.5 48.5 8 5.5 1 8 1.5 0.5 0.5
    Hungary 8.5 16 2 29.5 18.5 3.5 6.5 3 8 0 0 0.5 750
    Slovakia 6.5 16 1.5 41.5 14.5 4 2 1 6.5 0.5 0.5 3 484
    Slovenia 9 20.5 1.5 38 18 1.5 2.5 0 5 1 0 0 465
    Switzerland 14 1.5 8 3.5 50 7.5 3 0.5 7.5 0.5 1.5 1 282

    Eastern Europe

    Region/Haplogroup I1 I2a I2b R1a R1b G2a J2 J1 E1b1b T Q N1c1 Sample size
    Belarus 5.5 17.5 1 51 5.5 1.5 2.5 1 4 0 0 10 1998
    Poland 8.5 5.5 2 57.5 12.5 1.5 2.5 0 3.5 0.5 0.5 4 2740
    Russia 5 10.5 0 46 6 1 3 0 2.5 1.5 1.5 23
  • Bashkirs
  • 0 0 0 26 47 0.5 2 0 0 0 0 17 471
    Ukraine 4.5 20.5 0.5 44 8 3 4.5 0.5 6.5 1 0.5 5.5 1118

    South-Eastern Europe

    Region/Haplogroup I1 I2a I2b R1a R1b G2a J2 J1 E1b1b T Q N1c1 Sample size
    Albania 2 12 1.5 9 16 1.5 19.5 2 27.5 1 0 0
    Bosnia-Herzegovina 4.5 50.5 0 18 3.5 1.5 5.5 1 11.5 0.5 0.5 1 697
  • Bosniaks
  • 4 53.5 0 18 3.5 1.5 5 0.5 9 0 0.5 1 427
  • Bosnian Croats
  • 0 71 2 12 2 1 1 0 9 0 0 0 180
  • Bosnian Serbs
  • 7.5 32.5 0.5 20 3.5 1 8.5 3.5 17.5 1 0 1 90
    Bulgaria 4 20 2 17 11 5 11 3 23.5 1.5 0.5 0.5 1057
    Cyprus 0.5 4 0 3.5 9.5 13 28.5 9.5 24.5 2.5 0.5 1 1817
  • Greek Cypriots
  • 0.5 3 0 3.5 11 12.5 31.5 7.5 25 2 0.5 0 1201
  • Turkish Cypriots
  • 0.5 5.5 0 3.5 6.5 14 23.5 10 23 3.5 1 2 616
    Greece 3.5 9.5 1.5 11.5 15.5 6.5 23 3 21 4.5 0 0 1261
  • North Greece
  • 5.5 16 1 18 13 4.5 15 2.5 20.5 4 0 0 297
  • Central Greece
  • 3.5 7 3.5 11 11.5 6 19 3.5 29.5 5 0 0 148
  • South Greece
  • 1.5 9 1 10.5 20.5 3.5 19.5 1 27 4.5 0 0 243
  • Crete
  • 4 7 1 9 15 9.5 34 5 11 4 0.5 0 504
  • Aegean Islands
  • 3 3 2.5 10 19 8.5 20 3 22 6 0 0 69
    Kosovo 5.5 2.5 0 4.5 21 0 16.5 0 47.5 0 0 0 114
    Macedonia 3 23 1.5 13.5 12.5 4 14 2 21.5 1.5 0.5 0.5 698
    Moldova 5 21 3 30.5 16 1 4 4 13 1 0 1.5 125
  • Gagauzes
  • 4 20 3 19 12.5 13.5 5.5 2 11 3 0 1 89
    Montenegro 6 29.5 1.5 7.5 9.5 2.5 9 0.5 27 0 2 1.5 404
    Romania 3.5 28 2.5 18 15.5 3 13.5 1 14 1 0.5 1.5 989
    Serbia 8 34 0.5 18 6 2.5 9 1 15 0.5 1 2.5 (N1a) 1788
    Turkey/Anatolia 1 4 0.5 7.5 16 11 24 9 11 2.5 2 4

    European Jews

    Region/Haplogroup I R1a R1b G J2 J1 E T L Q N Others
    Ashkenazi Jews 4 10 9 9.5 19 19 20.5 2 0.5 5 0 1.5
    Sephardic Jews 1 5 13 15 25 22 9 6 0 2 0 2

    Middle East

    Region/Haplogroup I R1a R1b G J2 J1 E T L Q N Others
    Armenia 4 8 28 11 22 11 5 6 4 0 2 1
    Azerbaijan 3 7 11 18 20 12 6 11 0 0 0 15
    Georgia 3.5 9 11 31 24.5 12 4.5 2.5 3 0 0 0.5
    Iran 0.5 15.5 9.5 10 23 8.5 6.5 3 6.5 5.5 1 10.5
    Iraq 5 6.5 11 3 27 31 11 7 3 0 0 0
    Kurdistan 6 10.5 11 5 23.5 12 12.5 5.5 2 0.1 0 11.5
    Lebanon 3.5 3 6.5 5 34 13 20 3.5 5 1 0 5.5
    Syria 5 10 13.5 3 17 30 11.5 5 3 0 0 2

    North Africa

    Region/Haplogroup I R1a R1b G J2 J1 E T L Q N Others
    Algeria 0 0.5 9.5 0.5 5 22 59 0 0 0.5 0 3
    Egypt 0.5 2 6 5.5 6.5 21 46 6 1 0.5 0 5
    Morocco 0 0 4.5 0.5 1.5 6.5 83 0 0 0 0 4
    Tunisia 0 0.5 2 0.5 3 16.5 72 1 0 0 0 5.5

    Follow-up

    Ask your questions and discuss about haplogroups on the Forum


    Eupedia
    © 2004-2022 Eupedia.com All Rights Reserved.