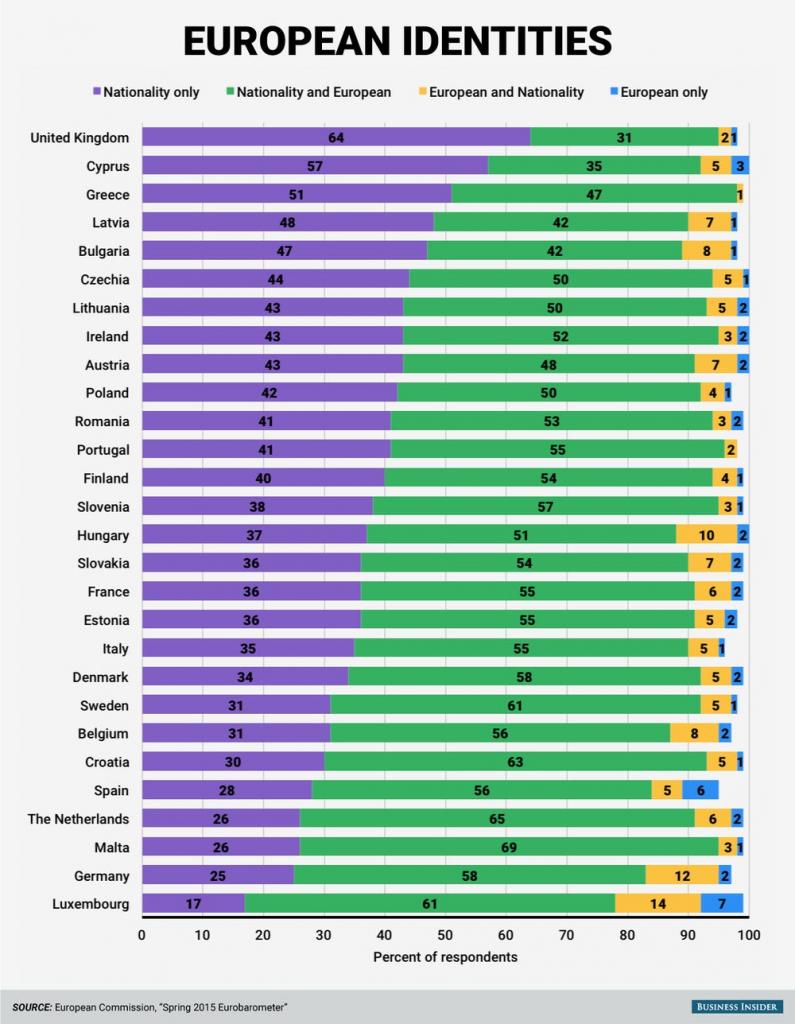
Tautalus posted an interesting graph showing what percentage of Europeans identified with their nationality and/or "Europeanness".

This dates back to 2015, so for more up to date information I checked the latest Eurobarometer on Values and identities of EU citizens (published in November 2021). The report is 191 pages long and is a treasure of information to compare how Europeans see themselves in each country.
The questions relating to national identity include an analysis of answers by gender, age, education, social class, political values, religiousness, life satisfaction, and personal values.
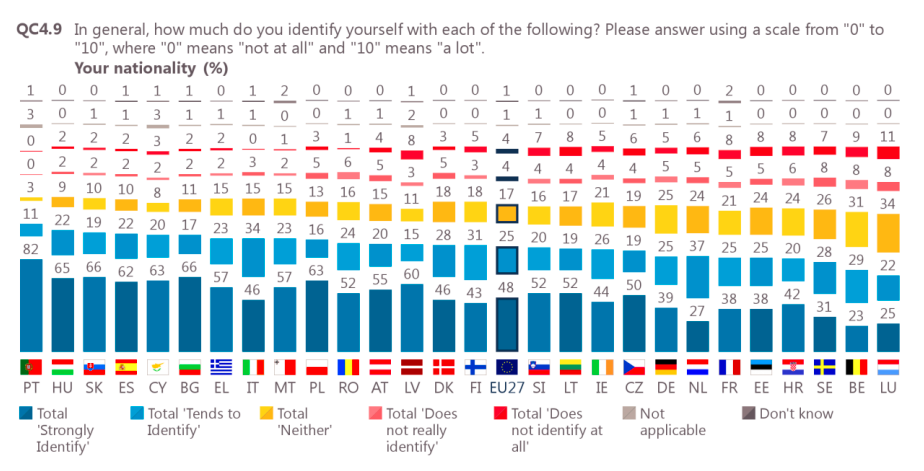
Percentage of Europeans who identify with their nationality

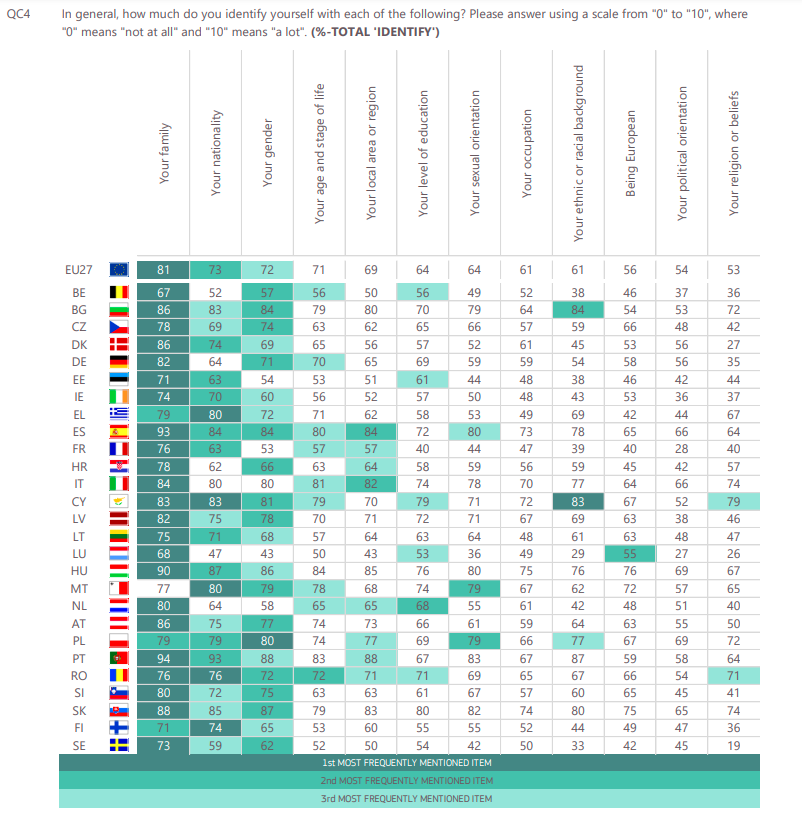
Countries where national identity is the strongest are Portugal (93%), Hungary (87%), Slovakia (85%), Spain (84%), and Cyprus and Bulgaria (both 83%). At the other end of the scale we find Luxembourg (47%), Belgium (52%) and Sweden (59%).
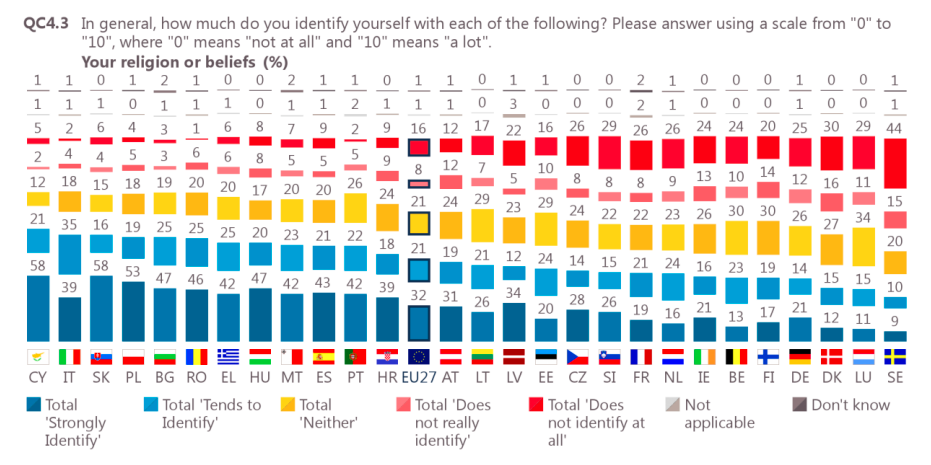
There is hardly any difference between gender or life satisfaction. However people who are over 55 years old, didn't complete secondary school, consider religion important, consider themselves working class and traditionalist are considerably more likely to strongly identify with their nationality. The upper-middle class and non-religious people were the least likely to hold such feelings.
Percentage of Europeans who identify with being European

Feelings of European identity run higher in n Hungary (76%), Slovakia (75%), Malta (72%), Cyprus and Poland (both 67%), Romania and Czechia (both 66%), Spain and Slovenia (65%), Italy (64%), and Lithuania, Latvia, and Austria (all 63%). The lowest percentages were observed in Greece and Sweden (both 42%), Croatia (45%), Belgium and Estonia (both 46%), theNetherlands (48%) and Finland (49%). But to put this in perspective, Belgians and Swedes also do not feel particularly attached to their national identity. In Belgium 52% of the population identify as Belgian and 46% as European, so it's almost identical, and one does not preclude the other either. There are just a lot of people who don't care either way. Local/regional identity shows a similar pattern with just 50% of the population saying that they identify with it.
Those most likely to identify as being European are the upper class (42% of them do), while the least likely were the lower middle class (26%) and those not satisfied with their lives (24%). Otherwise there is little difference across gender, age groups, educational attainment, urbanisation or political spectrum.
The category of people who had the highest percentage of "Does not identify at all with being European" are those who have a negative image of the EU (20%), which seems rather obvious, but also those who have difficulties paying the bills most of the time (13%). It could be that the latter group includes more immigrants from developing countries who clearly don't see themselves as European.
This dates back to 2015, so for more up to date information I checked the latest Eurobarometer on Values and identities of EU citizens (published in November 2021). The report is 191 pages long and is a treasure of information to compare how Europeans see themselves in each country.
The questions relating to national identity include an analysis of answers by gender, age, education, social class, political values, religiousness, life satisfaction, and personal values.
Percentage of Europeans who identify with their nationality

Countries where national identity is the strongest are Portugal (93%), Hungary (87%), Slovakia (85%), Spain (84%), and Cyprus and Bulgaria (both 83%). At the other end of the scale we find Luxembourg (47%), Belgium (52%) and Sweden (59%).
There is hardly any difference between gender or life satisfaction. However people who are over 55 years old, didn't complete secondary school, consider religion important, consider themselves working class and traditionalist are considerably more likely to strongly identify with their nationality. The upper-middle class and non-religious people were the least likely to hold such feelings.
Percentage of Europeans who identify with being European

Feelings of European identity run higher in n Hungary (76%), Slovakia (75%), Malta (72%), Cyprus and Poland (both 67%), Romania and Czechia (both 66%), Spain and Slovenia (65%), Italy (64%), and Lithuania, Latvia, and Austria (all 63%). The lowest percentages were observed in Greece and Sweden (both 42%), Croatia (45%), Belgium and Estonia (both 46%), theNetherlands (48%) and Finland (49%). But to put this in perspective, Belgians and Swedes also do not feel particularly attached to their national identity. In Belgium 52% of the population identify as Belgian and 46% as European, so it's almost identical, and one does not preclude the other either. There are just a lot of people who don't care either way. Local/regional identity shows a similar pattern with just 50% of the population saying that they identify with it.
Those most likely to identify as being European are the upper class (42% of them do), while the least likely were the lower middle class (26%) and those not satisfied with their lives (24%). Otherwise there is little difference across gender, age groups, educational attainment, urbanisation or political spectrum.
The category of people who had the highest percentage of "Does not identify at all with being European" are those who have a negative image of the EU (20%), which seems rather obvious, but also those who have difficulties paying the bills most of the time (13%). It could be that the latter group includes more immigrants from developing countries who clearly don't see themselves as European.


